One of the key ingredients in improvement—either personal or professional—is honesty. How often have you heard it said that the first step to solving a problem is admitting that you have one? Among the difficulties IT has had historically is the disparity between what standard metrics say and what the “word on the street” is. This disparity has confused and irritated CIOs who look at their metrics dashboard and see customer satisfaction numbers ranging from 77% to 94% satisfied or very satisfied but are accosted after meetings across the business by executives and others who say that IT consistently lets them down. How and why does this happen? Which is right: the metrics or the “word on the street”?
The fact is, the metrics are right, and the word on the street is right. How can that be?
- Customer Satisfaction (CSAT) is often measured only by the service desk and does not generally cover IT.
- CSAT surveys are sent to those who have interacted with the service desk and ignore the 30% or so of users who have not reported an incident or service request.
- CSAT surveys are transactional, asking only about the latest interaction.
- Most end-users ignore the survey, making the sample relatively small in relation to the end-user or customer population.
- Many surveys are poorly designed and skew the results.
- Metrics are frequently “gamed” by IT staff.
- Metrics are often set as targets, making the goal “a 90% CSAT rating” instead of asking, “What makes our customers and end-users happy?”
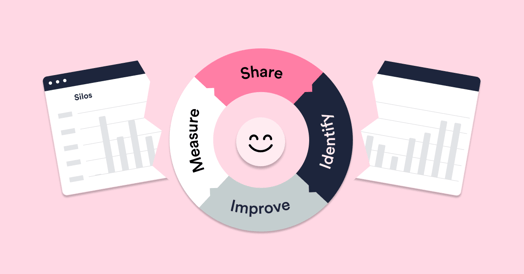
Silos obscure the view
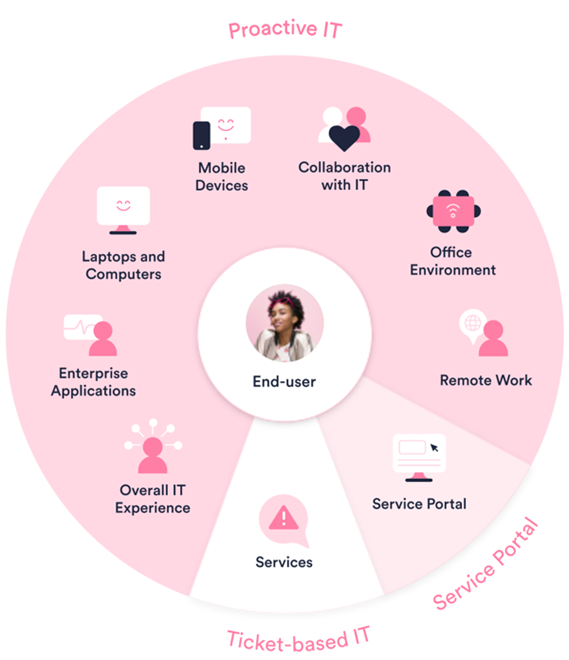
The service desk may be “the face of IT” in your organization, but it is not IT. Information Technology underpins so much of our working life—from the applications we use to the data we gather to the networks that bind it all together. Judging all of these complex relationships based on occasional transactions with one single component doesn’t make much sense once we stop to consider it. We (IT) seem to be approaching our work as if the only thing that matters is the score, not the value we provide or the operations we enable.
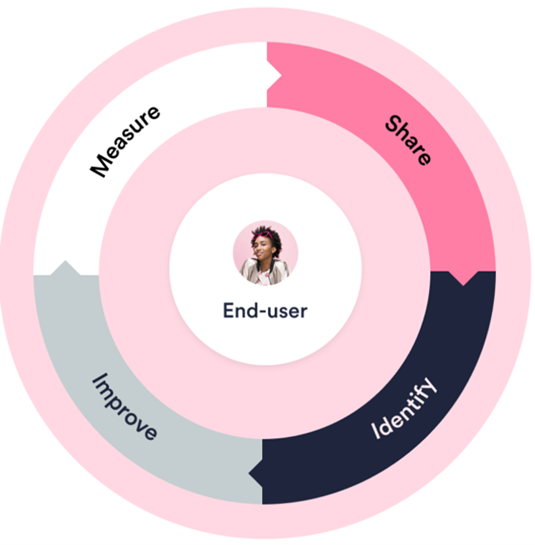
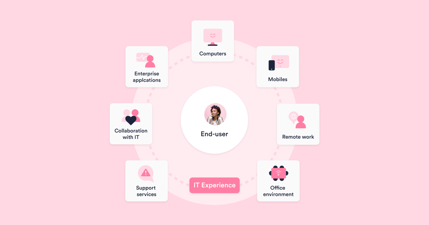
The ITXM™ Framework suggests that measuring is the first step. It also suggests that we measure far more broadly than typical ticket-based surveys and gather end-user feedback as close to real-time and as continuously as possible. Suppose we begin by breaking our habit of thinking only about tickets that represent transactions and in terms of silos like the service desk, applications, networks, databases, and so on. In that case, we can begin to understand the experiences—good and not-so-good—that our end-users are having. They don’t perceive databases; they consume the services based on the data. IT services are enabled by all the components—databases, applications, networks, devices, and people—that deliver those services.

The second step in the ITXM Framework is sharing, and that’s the one we’re most concerned with here. Historically, IT tried to control how our metrics were reported and to whom they were given, keeping with the general business tendency to “look good” rather than demonstrate real value. ITXM, on the other hand, guides organizations to share widely, honestly, and openly, not creating PowerPoint® presentations or canned reports but showing the raw data gathered from end users.

This approach requires an open, honest, and blameless approach to recognizing and solving problems, creating a pathway to continuous improvement. This is where many organizations struggle, but this is also where substantive change and improvement begin.
Because of the fear of “looking bad,” we may forget that much of the feedback we get from sharing may be good. IT may have strengths in areas it hasn’t recognized and maybe getting it right more than we suppose. When we start sharing our end-user experience data, it’s a bit like bringing home a school report card to show our parents: It can be scary, but more often than not, it results in guidance rather than punishment.
One of the key reasons to share the experience data broadly and openly is to show how IT is addressing problems, issues, and suggestions that arise.
This is often called “You said, we did” communication, and end-users can see how their feedback drives IT improvements that positively affect operations and outcomes. – Happy Signals
Sharing allows for open and honest discussion of what went right, what went wrong, and what needs improvement. The more frequently sharing happens, the less anxiety it causes and the more beneficial it becomes.
Breaking silos
But there’s another effect as well. When there’s open discussion, people begin to feel that they are part of the whole organization instead of just their own line of business. This is undoubtedly true for IT, where specializations (network, data, development, support, etc.) tend to breed isolated viewpoints. When end-user experiences about the services they consume are discussed, the siloed areas of IT start to see that the creation, delivery, and support of those services are a whole, not separate entities or components. When end-users write and send an email, they aren’t thinking about the laptop, the software license, the wireless infrastructure, the data storage, the anti-malware, etc. They’re sending an email. When it doesn’t work how they expect it to, they don’t care which of the various technical elements of the email system failed; they care that it took them five times as long to send the email because they had to restart their computer or recreate a lost draft. It was not the experience they expected.
We cannot improve the things we don’t know about. Gathering experience data helps us to learn more about the effects of our IT work. Sharing the data stimulates open discussion and conversation, helping to break silos and find the pathways to improvement.
To learn more about the ITXM Framework, please visit: https://www.happysignals.com/itxm-framework-it-experience-management


