Usually, in early childhood, we become aware that our reflections don’t look the same as we do in photographs or videos. We raise our right hand; our reflection raises the left hand. Our facial features are reversed and look strange to us in photographs. Selfies don’t give us “true” pictures, either. We’re often looking at the camera controls or lining up the photo to capture ourselves standing in front of whatever landmark we visit that day or squeezing others into the photo.
The closest we get to an accurate self-image is when someone else takes the picture and catches us being ourselves.
Good experience metrics are like good portraits. They also catch us in the act of being ourselves. We get to see ourselves as others see us. Too often, IT directors or CIOs go into meetings with counterparts from around the company feeling good because the latest satisfaction numbers from the service desk are high but come out of those meetings bruised from being told that IT is obstructive, unresponsive, and non-innovative. The IT leaders are left wondering how they missed this when their dashboards are showing all green.
The Watermelon Effect
“The ‘Watermelon Effect’ is a metaphor for a situation where IT service performance metrics and KPIs appear to be hitting their targets (green on the outside) despite evident signs of an underlying dissatisfaction and frustration with the IT services among the employees and business stakeholders (red on the inside).”
Let’s consider how this happens.
Limited Scope: IT is sending out surveys to those who have had an interaction (“opened a ticket”) with the service desk. Although statistics are not readily available, most estimates say that around 65% of employees have contact with IT support over the course of a year, including self-service and the portal. Sending out a survey for every incident and every service request—even if everyone responds to the survey—still ignores a substantial number of people and the day-to-day experiences they have with their technology.
To put this in more realistic terms, if 65% of employees receive a survey and 20% respond, only 13% of employees are telling us how we did. We’re judging our success by a small fraction of the employee population.
Bias: If I’m going to be judged on the survey results, I have an incentive to design the survey to put myself in the best light possible and to ask questions that will nudge people toward positive responses. IT designs its surveys to give the results it wants or needs, whether we are conscious of it or not.
Both of these issues are the result of inside-out thinking. Author and customer experience leader Annette Franz puts it this way:
“Inside-out thinking means your focus is on processes, systems, tools, and products that are designed and implemented based on internal thinking and intuition. The customer’s needs, jobs, and perspectives do not play a part in this type of thinking; they aren’t taken into consideration.”
What the Mirror Tells Us
We look in the mirror to check our appearance. Usually, we’re just making sure we don’t have any apparent stains on our clothes and that we haven’t cut ourselves shaving or botched our makeup. If we’re going on a date or to a more formal event, we pay closer attention. Again, we’re looking at a literal mirror image of ourselves, not our true appearance. If someone photographs us later, we’ll see that our hair and clothes look different when we see them “right way around.”
Likewise, we are likely off the mark when we form an opinion of ourselves based on our own inside-out thinking. We think we’re doing fine—and all our metrics say we are—but we haven’t seen ourselves from the perspective of others. We see the green part of the watermelon; too often, they see the red.
ITXM
There is a way for us to get a good, human-centric, sharp portrait view of our work. It’s by asking everyone—not just those who have opened a ticket—to tell us how the people, processes, and tools provided by IT are working in support of their efforts to accomplish work and produce value for their company and their company’s customers.

For most of their workday (thankfully), our fellow workers do not interact with the service desk or portal. They are, however, interacting with their devices, the applications they use, their work environment, and all the services IT provides. Huge portions of this picture are missing if we focus only on ticket-driven interactions.
Taking the holistic view provided by ITXM cuts through the watermelon to expose the true nature of the relationship between IT and the consumers of its services and products. The framework accomplishes this by looking at both Productivity and Happiness.
Productivity is measured by tracking the time service consumers say their work has been stifled or even idled by IT infrastructure and/or service issues. (Notice that we’re looking at this from the outside vantage point, not the IT Mean Time to Restore perspective. MTTR is like the mirror; experience-based Lost Time is like the photo or video portrait. This aspect of ITXM is critical: it points the way to specific improvements that need to be made.
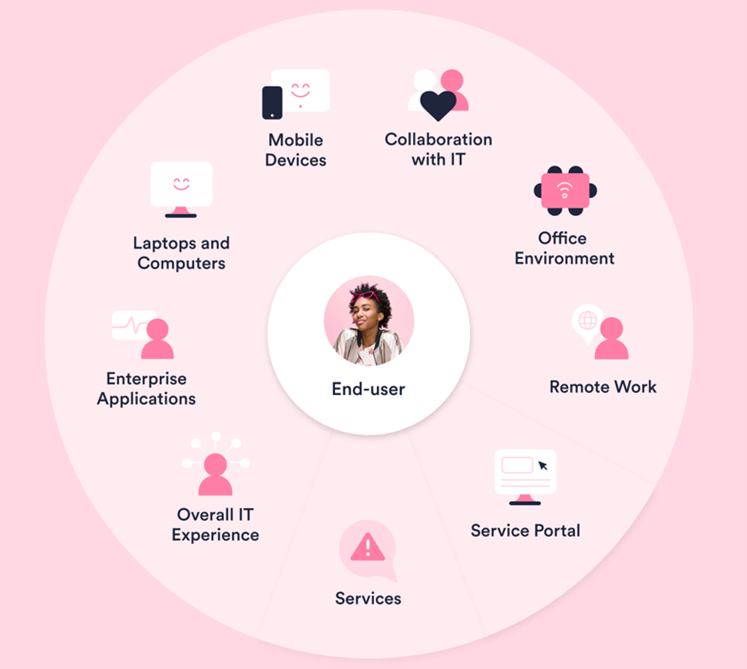
Happiness allows service consumers to score how they feel about the various aspects of their IT ecosystem, as shown in the graphic above. This score shows which aspects of their IT environment matter most for the relationships that help create good workplaces and increase employee engagement and retention.
Human-Centric
ITXM goes far beyond the usual what’s working and what’s not type of metrics. It works on the premise that “Humans are the best sensors.” Given the opportunity, our colleagues will tell us what we are getting right and where we need to improve. They will let us know what is important to them. They’ll give our services, hardware, and applications a 360-degree walkaround and deliver a video-style view far exceeding any information we get while standing in front of a mirror.


