Traditional IT metrics didn't meet Orbis's ambition level and goals for customer experience development in their strategy.
"We could say that 97% have rated us between 7/10 - 10/10. But what can we do with that information? How can we get better?"
Orbis decided to go after a broader understanding of what factors influence the IT service experience the most. HappySignals became a central part of its continual improvement process.
COMPANY
- Industry: Federal & Public Sector
- Employees: 25 000
- ITSM Platform: Cherwell
- ServiceDesk: Internal
- HappySignals since: July 2019
Outcomes
Happiness
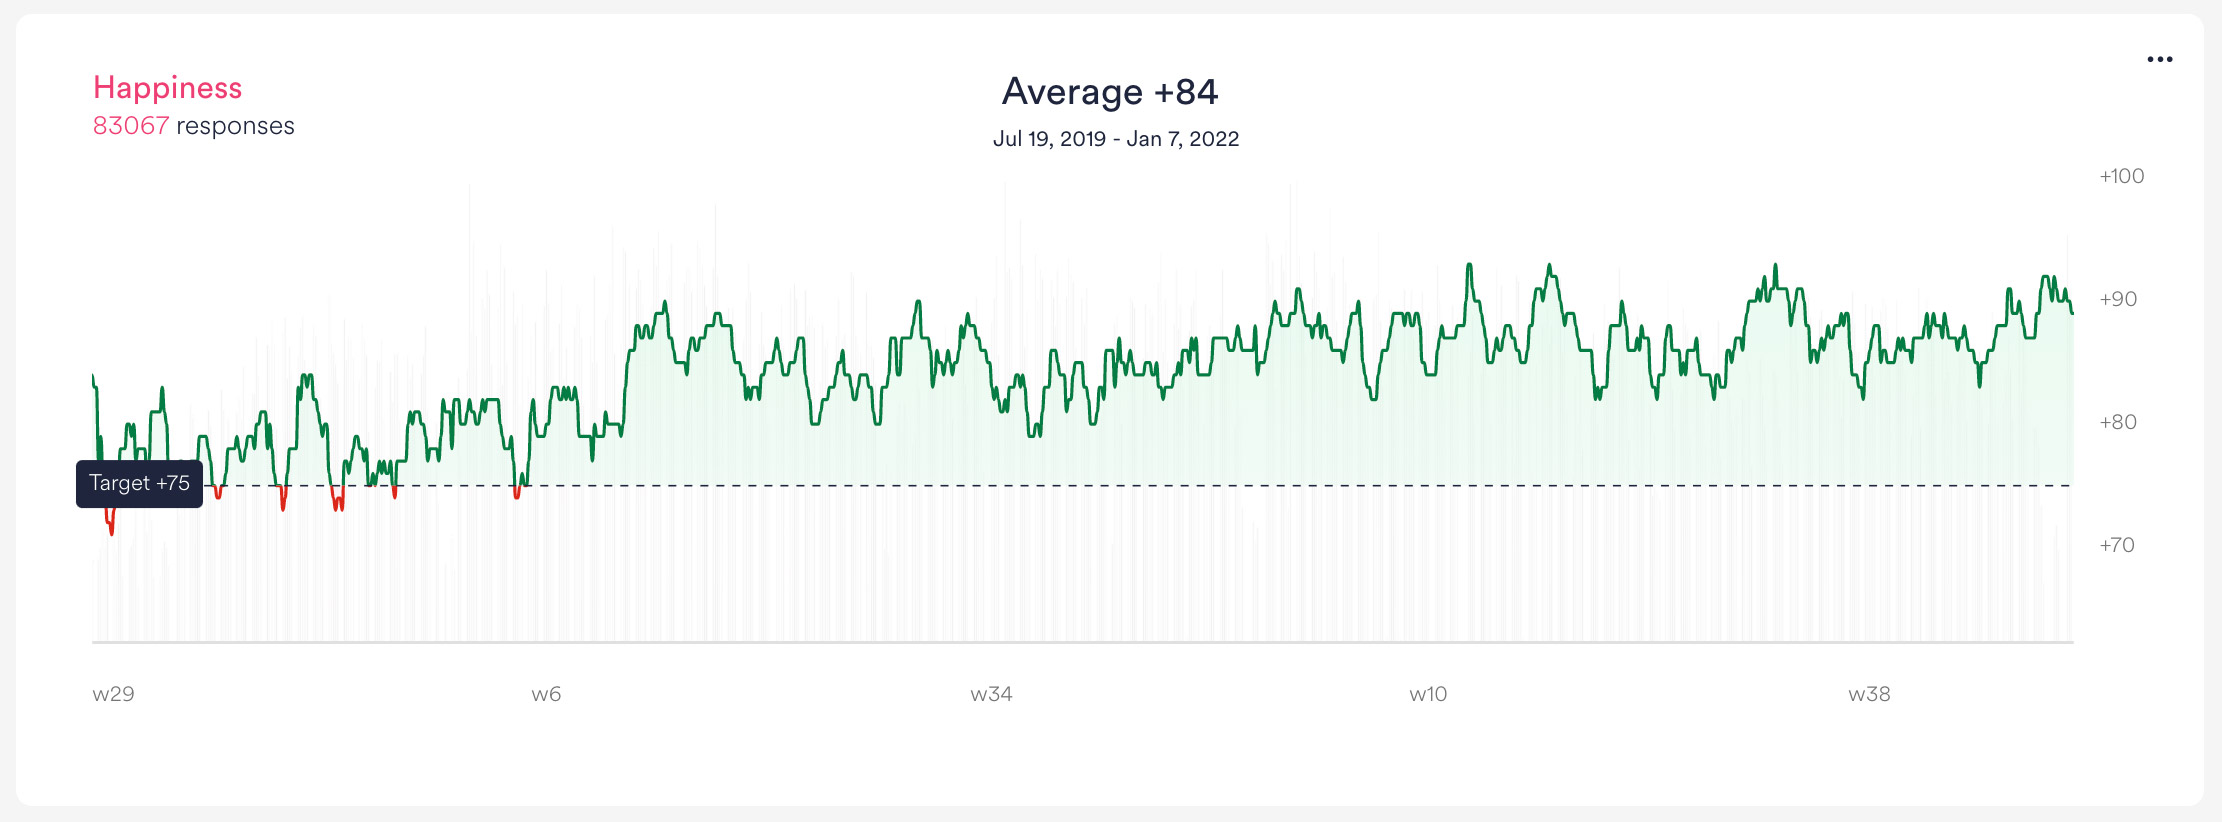
75
Before
91
After
21%
Increase
Low happiness uncovered mobile phone contracts did not meet needs
£40k
Saved per month in iPhone contracts
£480k
Annual savings

How HappySignals is used at Orbis
1. An improvement team with 5 people
The continual improvement team predominantly looks at HappySignals data to find improvement areas.
2. A dedicated mobile phone experience team
The team managed to raise iPhone-specific happiness from 24 to 99, and uncover over £500k in savings per year in optimized contracts.
3. Moving from SLAs to XLAs
Using HappySignals data to progressively move from SLAs to XLAs
4. Live Screens in the office
Making experience data visible to create a culture that supports XLA-driven IT service management.
5. Organizational changes to support experience management
New teams have been created to identify the areas that need improvement, leading to tangible benefits beyond the scope of ITSM.
Challenges overcome with HappySignals
HappySignals is the first source of insights when deciding on improvement initiatives
The challenges that were identified before using HappySignals and overcome with the help of the platform were:
- Orbis felt that its old IT metrics did not accurately show what it could improve to increase end-user/customer satisfaction. This was possible with HappySignals.
- Before HappySignals, it was harder to identify the improvement initiatives that would have a clear positive impact on the end users.
- Without easily understood experience data it was much more challenging to share with the business stakeholders of how good IT was at providing services to end users.

"No more 'so what metrics’ but a whole new spectrum of awareness and insight into improving customer experiences."
Kris Scruby
Tangible Benefits
Experience data from HappySignals shows the way forward for continual improvement initiatives
- Over £500k saved after discovering dissatisfaction with mobile phone contracts.
- Two new hires were made possible by proving cost savings and showing the value of IT for the organization
- HappySignals data has become the shared language that all of IT interacts with and business stakeholders understand.
- Automating how feedback is shared by channeling positive feedback back to agents and negative feedback to team leaders.
- HappySignals data is pulled into BI dashboards built on Tableau for broader analysis with other data sources.

How they got there
Experience data is seen as the guiding light that shows improvement areas
- Dedicated staff to look at HappySignals data on a regular basis
- First looking at experience data when identifying a new improvement initiatives
- Transparent communication back to the business to show their feedback matters
- A holistic view of IT using experience data together with other data sources
- Using data from HappySignals to motivate IT teams
Use cases where Orbis Partnership
uses HappySignals
See which use cases helped Orbis Partnership achieve their IT success,
and find other cases suitable for your company needs.
- Service Desk operations
- Moving from SLAs to XLAs
- Continual Service Improvement
- Happiness as a common focus for IT
- Automation projects
- Collaboration between IT and business


