Watch the Webinar
Discover the latest findings from the 2023 Global IT Experience Benchmark
This report analyzes responses from 1.86 million IT end-users across 130 countries, examining happiness and perceived time loss among various industries, company sizes, service desks (internal vs. outsourced), and global variations in IT support profiles.
.png?width=686&height=800&name=happysignals-global-it-benchmark-hero%20(1).png)
If you're a CIO, IT Leader, Experience Owner, or Service Owner, you need to understand what the word "experience" refers to in the context of Digital Employee Experience (DEX), Experience Level Agreements (XLA), and other three-letter acronyms.
Finance & Insurance is the industry with the happiest end-users that lose the least time.
The larger the organization, the more time end-users perceive losing per incident.
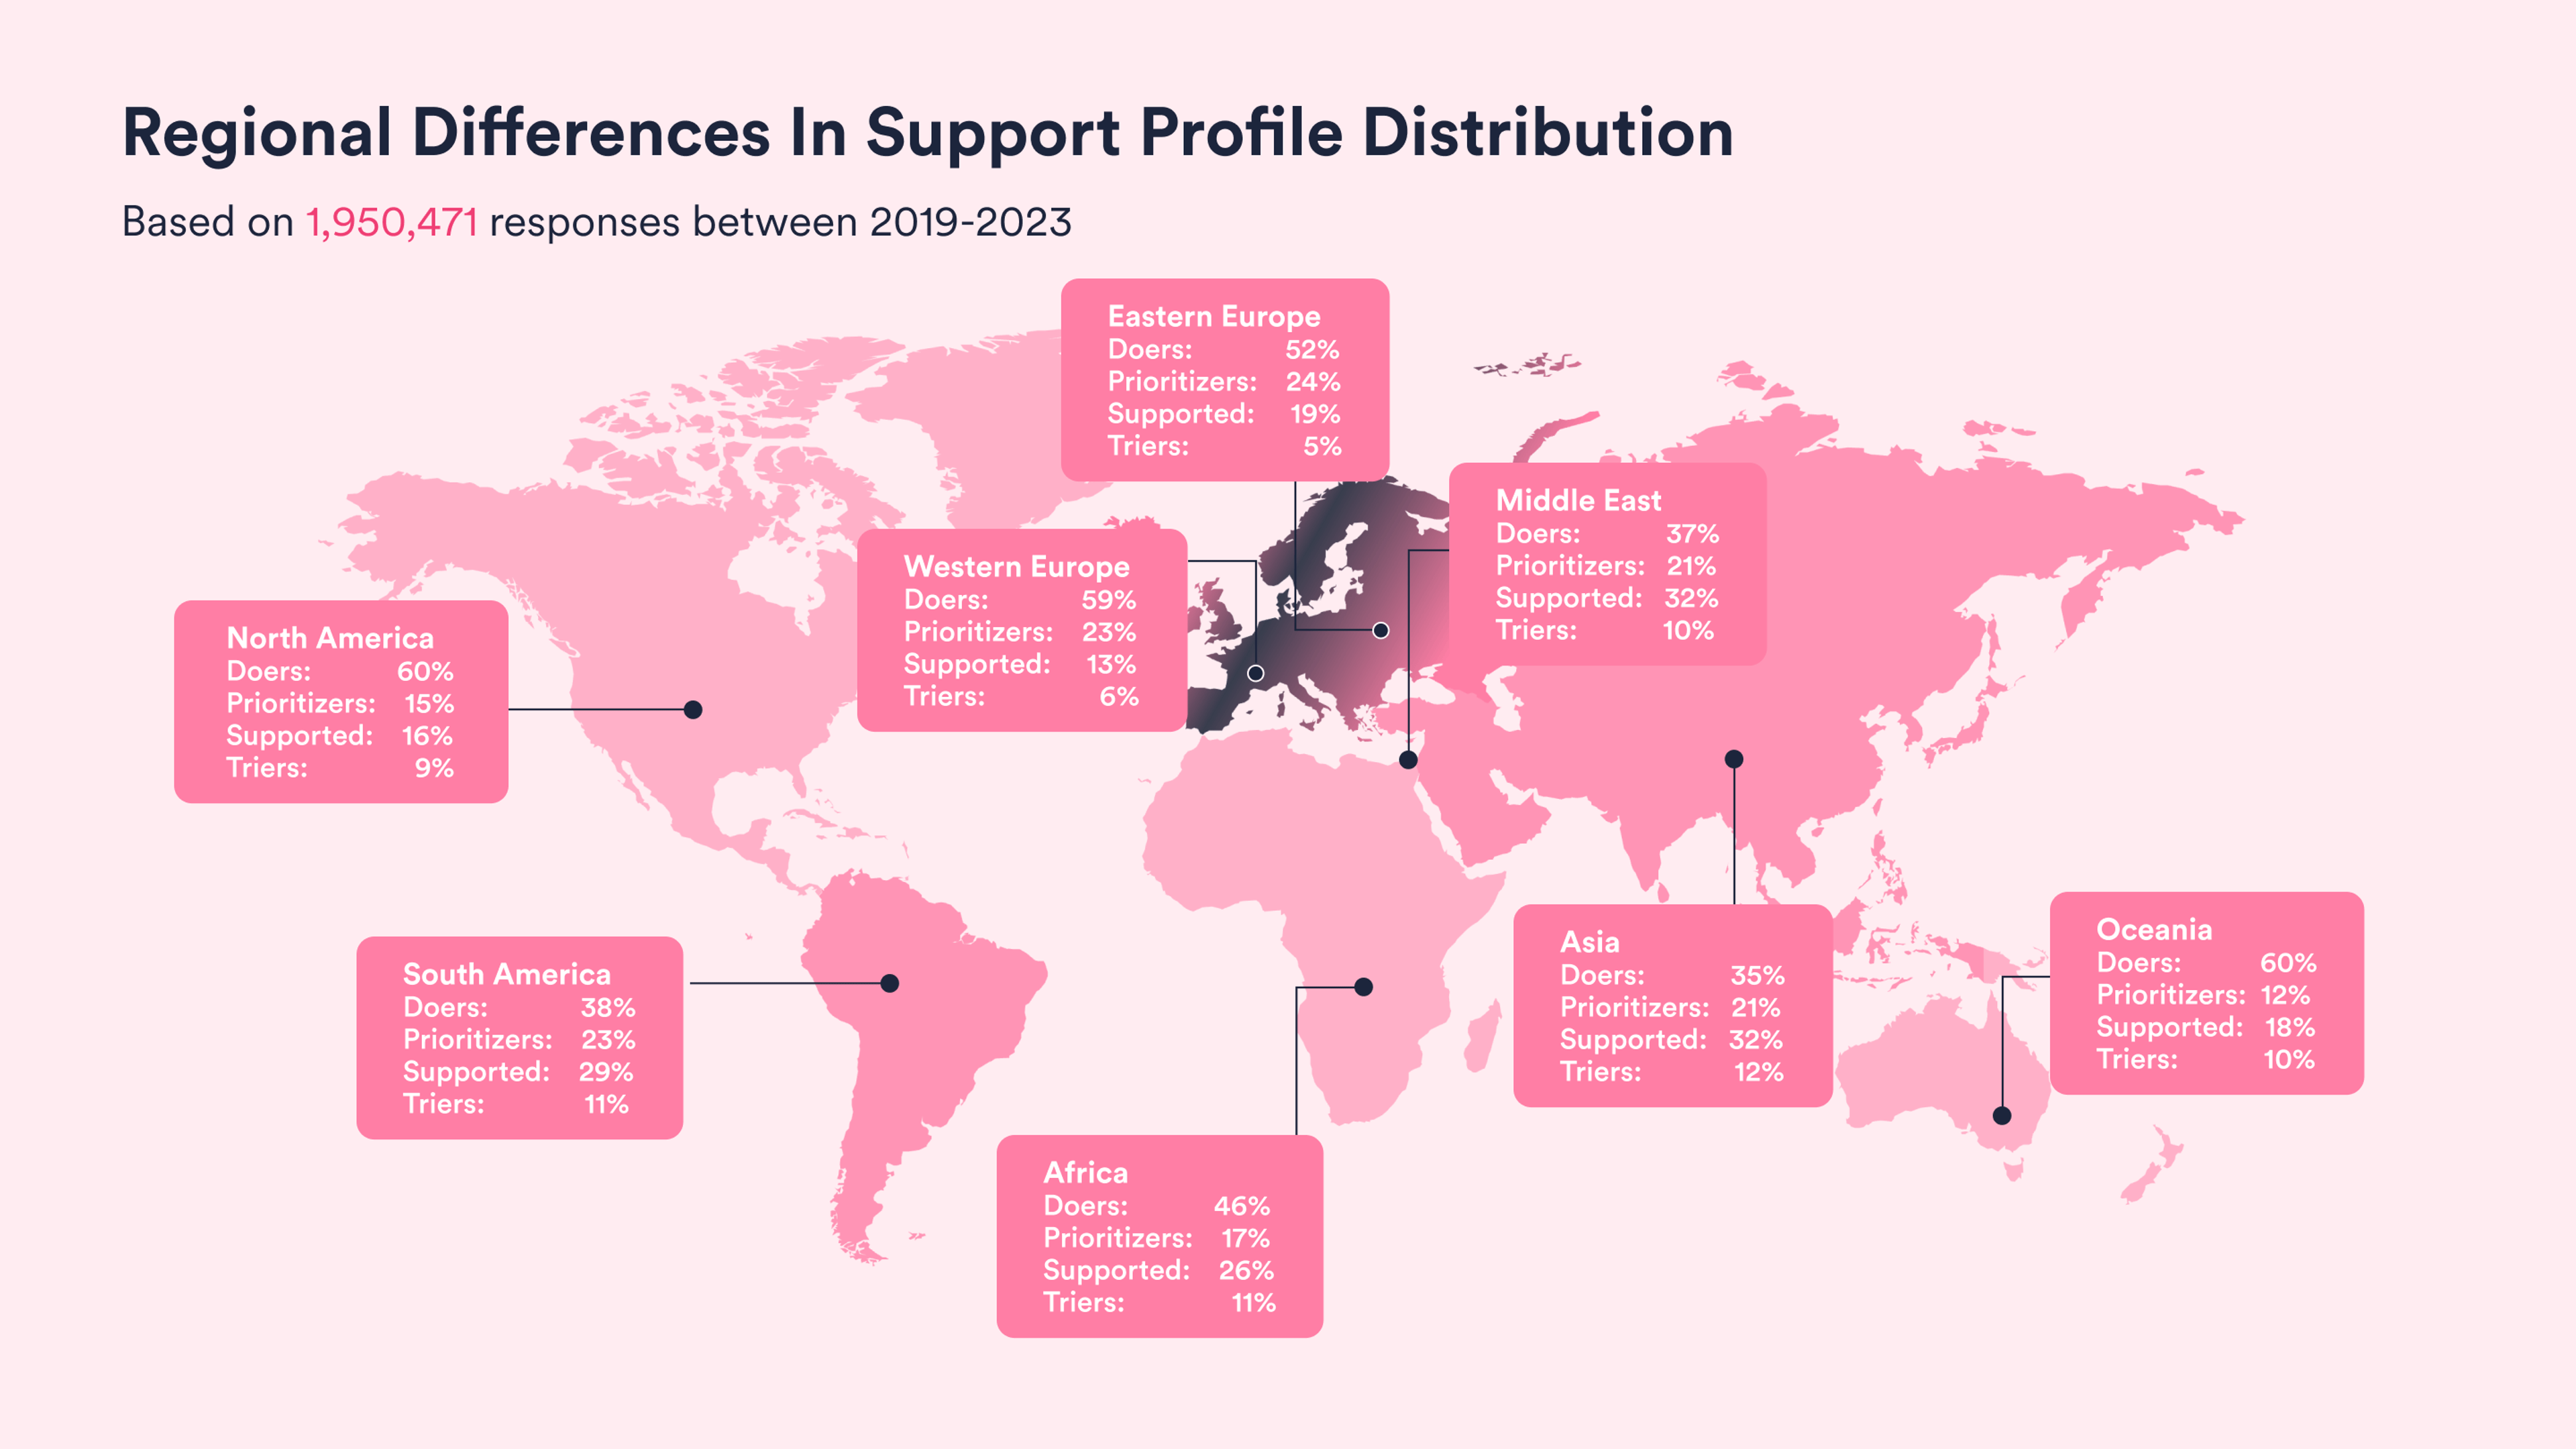
Support Profile distribution varies a lot between geographical regions.
For the first time, remote work satisfaction surpasses IT service satisfaction, indicating strong end-user appreciation for remote work capabilities and benefits.
In 2014, when HappySignals was founded, IT professionals at industry events shrugged their shoulders at the idea of making the end-user experience a central part of how IT was measured. The Watermelon Effect in IT was alive and kicking, and Human-Centric IT was seen as a niche thing. In 2024, IT Experience in different forms is close to crossing the chasm into the mainstream. Yet, there are nuances. We can see how large organizations are much more educated on the topics of XLAs, IT Experience Management (ITXM), and DEX.
The most mature organizations have established clear expectations for ITXM, use different tools for specific roles and purposes, and have established transparent collaboration between different parts of IT.
This is not to say that ITXM would be easy to get started with. A Gartner whitepaper from August 2023, “Establishing XLAs When Engaging With IT Service Providers,” found several reasons why XLA implementations failed to deliver on expectations. One reason was “service providers disguising legacy SLAs as XLAs for clients, driving the wrong perception about the effectiveness of XLAs.”
Any organization looking at managing IT based on experience can benefit from starting with defining what experience means in the context of IT. Who would be using the data? What are the main objectives? How do those objectives support broader business goals?
In ITXM, the chosen definition of experience will drive the metrics that reflect experience. The complexity of the metrics will, in turn, dictate how easy they are to understand, how time-consuming they are to analyze, and how broad the potential buy-in from different parts of the business will be. HappySignals has, since its creation ten years ago, stuck to a straightforward principle: Humans are the best sensors.
As you read this report, you can confidently know that when we speak about experience, it is what it says it is. The numbers in these reports will always reflect what the end-users themselves expressed as their experience—not aggregated numbers from technical or process data, no disguised SLAs, just experience, as felt by the end-users themselves.
This report can help you better understand how to improve your internal IT experience and apply what you have learned in your organization.
Our benchmark data is collected from all HappySignals customers. Our customers are large organizations with 1000-350,000 employees who use the HappySignals IT Experience Management platform.
The Global IT Experience Benchmark 2023 Report analyzes over 1,86 million end-user responses in 2023, collected from our research-backed surveys.
This data represents large enterprises and public sector organizations using in-house and outsourced IT services in over 130 countries.
Data is gathered through continuous surveys tied to resolved IT tickets and proactively across various IT areas, measuring user happiness and end-user estimated productivity loss. Respondents also identify factors, the experience indicators, affecting their experience.
In every report, we present a different theme. The standard part of our report reflects our experience with ticket-based IT services. That data has been collected since 2019, and our data contains over 10 million end-user responses. Over the years, the focus has increasingly shifted toward a more holistic view of IT.
In this report, we are looking deeper into how end-users experience IT support with incidents across different industries, what types of support profiles (IT skills and support preferences) end-users represent, and what that means for IT service providers.
Happiness:
End-users rate how happy they are with the measured IT area (e.g., recent ticket-based service experience, Enterprise Applications, Mobile Devices, etc) on a scale from 0-10.
HappySignals then calculates the % of 9-10 scores - % of 0-6 scores = Overall Happiness (a number between -100 to 100).
Productivity:
End-users estimate how much work time they lost due to the IT touchpoint being measured.
Factors:
End-users select from a list of research-backed experience indicators – which we call Factors – that influenced their Happiness rating. Multiple factors can be chosen in each survey.
The surveys automatically tailor the factors shown to each end-user depending on the measured IT area and whether the Happiness rating given in the first question was positive, negative, or neutral.
IT Happiness across all measurement areas
When we work with benchmark data, we always seek to improve its quality. This year, we further refined data quality and streamlined comparisons to previous periods.
Starting from this report, we will move to a full-year reporting cycle instead of the half-yearly ones. This allows us to do more in-depth analysis of new findings.
As you read this report, you may find more variation in the numbers in areas like Collaboration with IT, Laptops and Computers, and Enterprise Applications. A part of the change is new data coming in from very large customers. Unless indicated otherwise, the average scores are based on the total average of responses.
Another change in 2023 was the breakthrough of AI with ChatGPT and other generative AI, which changed how technology was used at work.
Speculating about the results, the happiness with Laptops and Computers could be thanks to the wider deployment of DEX tools, which allow for the detection and fixing of technology issues with hardware much faster.
While collaboration with IT dropped from +84 to +70 between 2022 and 2023, the first quarter of data from 2024 already shows a rebound with scores around +75. In that sense, 2023 could remain an anomaly in an otherwise highly scoring-measurement area.
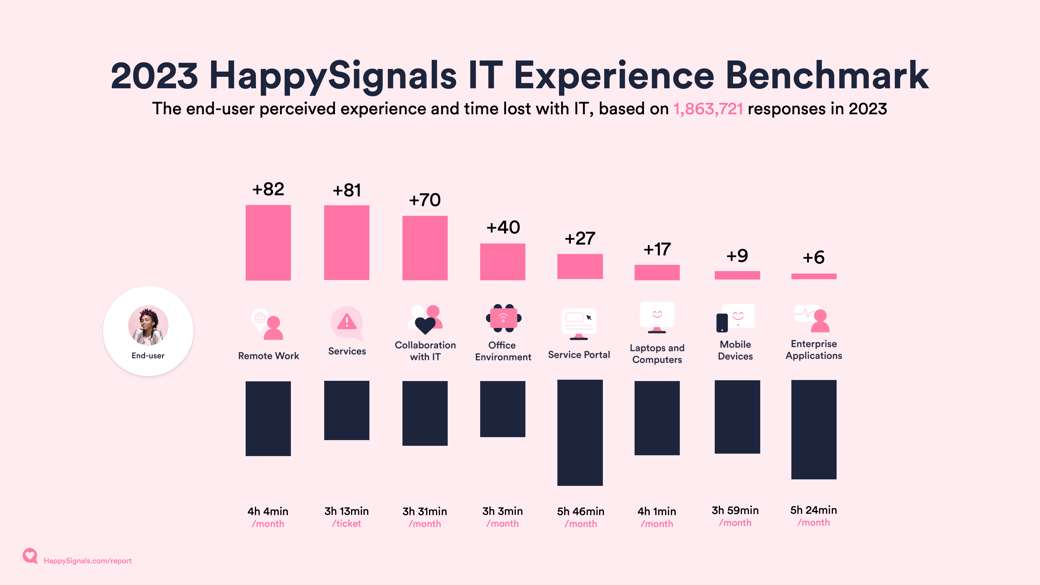
| Measurement Areas | 2022 | 2023 |
| Overall IT Experience | +34 | +39 |
| Services | +79 | +81 |
| Collaboration with IT | +84 | +70 |
| Remote Work | +77 | +82 |
| Service Portal | +32 | +27 |
| Office Environment | +40 | +40 |
| Mobile Devices | +8 | +9 |
| Laptops and Computers | +7 | +17 |
| Enterprise Applications | +12 | +6 |
What does this mean for your organization?
In conclusion, understanding which IT aspects employees are satisfied with and which are problematic allows the company to make informed decisions. This approach is more effective than relying on the leadership team's assumptions and leads to better outcomes in updating and improving digital tools at work. |
The Overall IT Experience survey offers ongoing feedback on general sentiments toward IT services and how much time people think they're losing each month to IT issues. Instead of just an annual check, it's a regular pulse. Users rate IT from 0 to 10 and then pinpoint the aspects affecting their scores. We summarize these factors to understand what shapes user views on IT services.
The average score for Overall IT Experience in 2023 was +39, an increase of +5 points from 2022
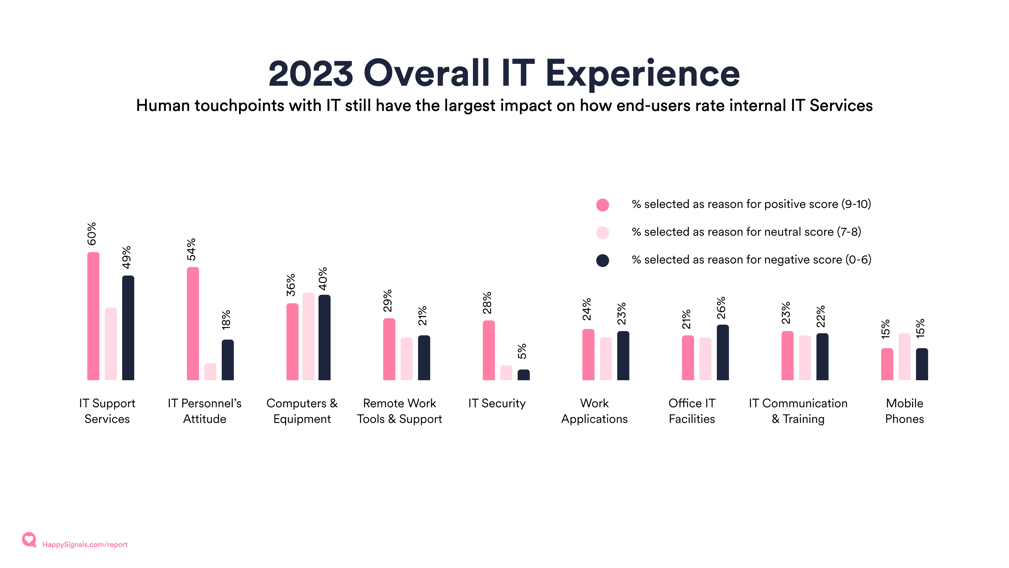
Based on the percentages of factors selected by end-users, here are some conclusions:
IT Support Services are highly influential: The most significant positive impact on the overall IT experience comes from IT support services, as shown by the high percentage of positive scores.
The attitude of IT staff matters: The attitude of IT personnel is a strong factor in how users perceive IT, with a majority indicating it as a reason for positive experiences.
Equipment quality is key: Computers and equipment quality also strongly influence positive perceptions, but they are notable in the neutral and negative categories, suggesting room for improvement.
Remote Work is crucial but could be improved: Remote work tools and support are crucial, as indicated by the significant percentage linked to positive experiences. However, a fair amount of neutral scores suggest that while it's important, users think it could be better.
Security is not a major positive driver: IT security has a small positive impact on the overall experience, with low percentages across all scores. This might indicate that while necessary, it doesn't significantly enhance user satisfaction.
Applications and Facilities need attention: Work applications and office IT facilities more often contribute to neutral and negative experiences, hinting at potential areas for improvement.
Communication and Training could be improved: IT communication and training are often cited in neutral and negative experiences, suggesting these areas don't always meet user expectations.
Mobile Phones are less troublesome: Mobile phones seem to be the least concerning, with lower percentages across the board, especially in negative experiences.
What does this mean for your organization?The Overall IT Experience factors highlight the importance of focusing on the human aspect of IT services to elevate the end-user experience. It's clear that attentive support, coupled with reliable equipment, significantly boosts satisfaction. The data also highlights a need for enhancements in remote work support, work applications, and IT facilities, which are areas where user experiences tend to be mixed. Investing in clear communication and comprehensive training of end-users can further improve satisfaction. Experience data helps IT refine its services and resources to meet user needs effectively, ultimately contributing to a more positive overall IT reputation within the company. |
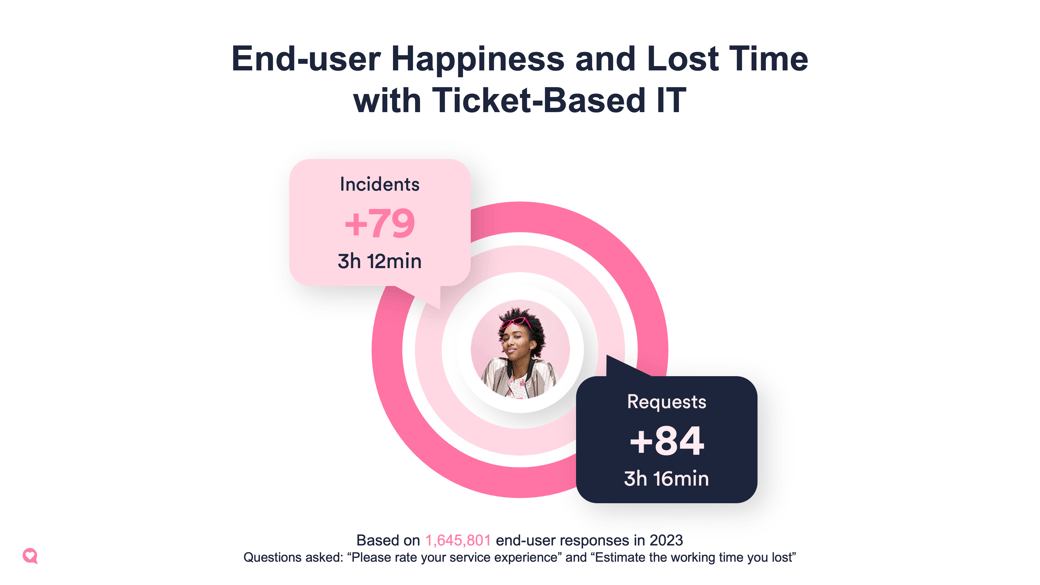
Looking at the difference between happiness and lost time with incidents and requests, it is good to remind oneself about the difference again. The results in this report are collected at the end of a resolved incident or a fulfilled request. Incidents are interruptions caused by an issue with something that used to work, while requests are end-users asking for something they need for work.
The most interesting differences are between Western Europe and North America:
We have been thinking about the reasons for this. For incidents, the end-users want something broken to be fixed. In these instances, North American end-users are happier when issues get solved, but when asking for something new, the perception of lost time is very high.
Is it about cultural differences or different ways IT services are aligned around processes? This is something organizations can look into in order to improve lost time in specific locations.
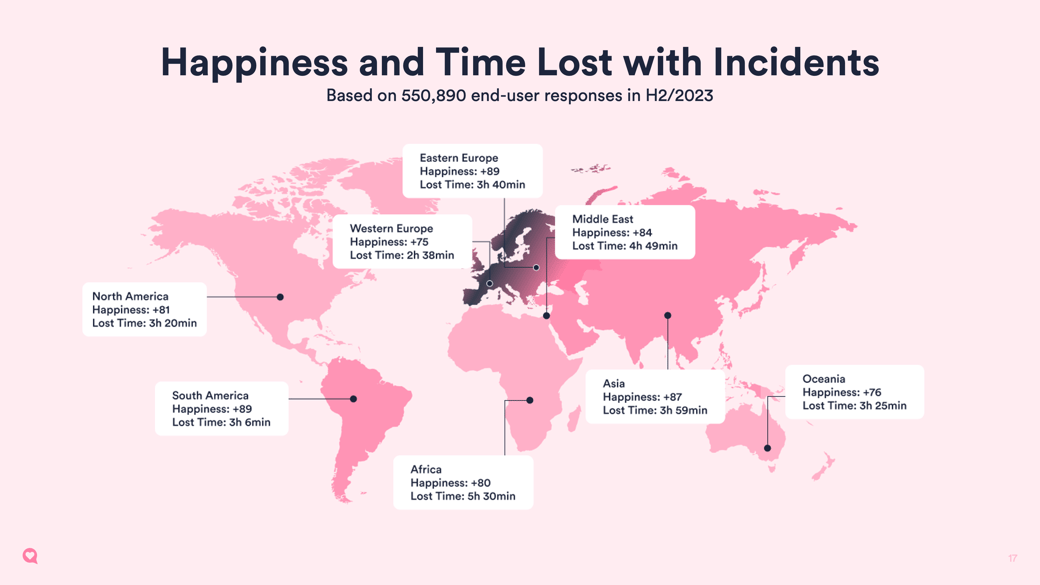
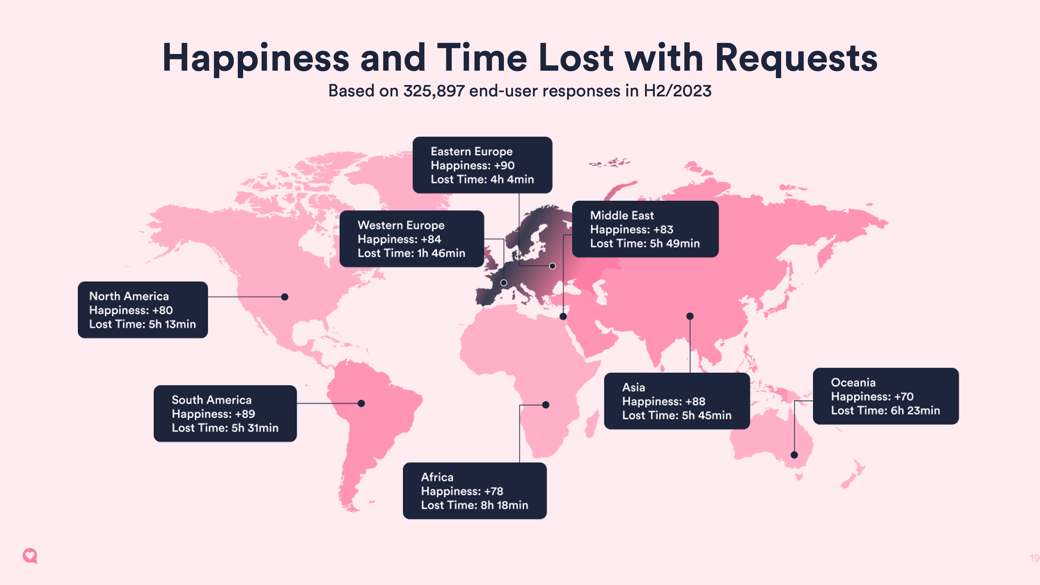
Different cultures perceive and evaluate IT services in different ways. A specific score in one region is not directly comparable to the same specific score in another region. Comparable benchmark data helps set expectations and provides an external angle for better understanding the end-user experience.
How to use this information in practiceIT service desk leaders can compare the scores to the country benchmark data to choose which countries to focus on. Using the comparison to benchmark data (in addition to internal averages) can help avoid pushing agents towards unachievable goals or reversely avoid getting too comfortable in regions where higher scores are culturally more common. |
Understanding the variation in IT Support profiles helps IT tailor services better to meet the preferences and skills of IT end-users. In this case, the profiles are adapted explicitly for ticket-based services and are more informative than prescriptive for other areas of IT.
In-depth information about profiles can be studied from our "Definitive Guide on IT Support Profiles." Still, the main differences are: Profiles are based on actual, regularly updated end-user responses, while personas are often hypothetical.
The results in this report are from almost 2 million end-user responses to questions that define their support profile.
Here's a quote from our Profile guide: "Profiles or Personas are both ways to describe and group customers based on their behavior and motives. Personas are semi-fictional representations of customers, often containing assumptions. Personas are usually based on market research and survey data with little interaction with the customer, whereas profiles rely on real customer conversations and interactions. When research is done in interaction with the customer, the assumptions (or hypotheses) about customer behavior and motives can be validated or invalidated in customer profiles."
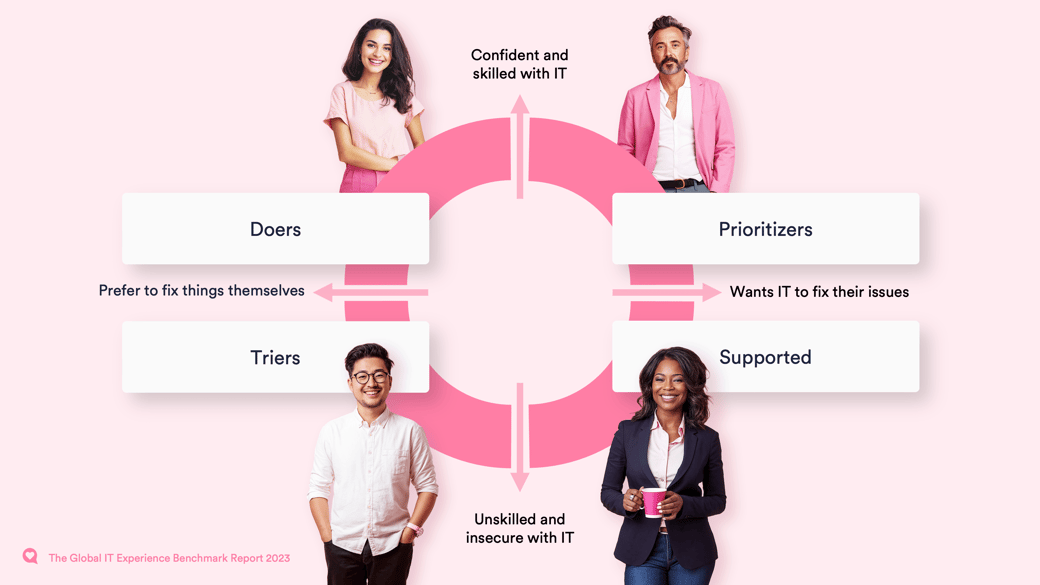
We have shown this graph to a few industry experts in the last couple of weeks, and a very common question that comes up is, "Does this reflect collectivist vs. individualist cultures?"
We can not wholly separate our professional cultures from our personal backgrounds. The regional differences are quite significant if we look at the most common support profile, the doers. Doers are end-users who like fixing things themselves and feel confident about doing so. They represent 55% of all users but are much less common in collectivist cultures in Asia, South America, and the Middle East. In these regions, doers represent less than 40% of end-users compared to Western Europe, North America, and Oceania, where doers represent 60% of end-users.
However, the results are not a pure representation of culture; instead, they can show differences in what kind of work is being done in different parts of the world. This becomes evident when looking at company and country-level data.
Our customers have a global footprint with millions of end-users across 130 countries, but the headquarters are still predominantly located in Western Europe or North America. This, in turn, in certain industries means some locations have a majority of office workers, while other locations have fewer of them. The needs and work preferences based on role can play an even larger role in the support profile distribution than the regional differences would suggest.
This is another example of the potential axis of analysis for future reports, understanding how much of the experience variations in different geographical locations depends on the cultural environment as a whole vs. the type of work and company culture.
Understanding the variation in IT survey response rates across different countries provides a perspective that the overall average fails to capture. Like support profiles, these variations can be attributed to cultural differences, local work dynamics, and user expectations. Taking these considerations into account allows you to work specifically on communication methods and support approaches to encourage end-users to provide feedback. Ensuring end-users know their feedback matters is the best way to drive higher response rates. That principle is applicable regardless of role and geographical location.
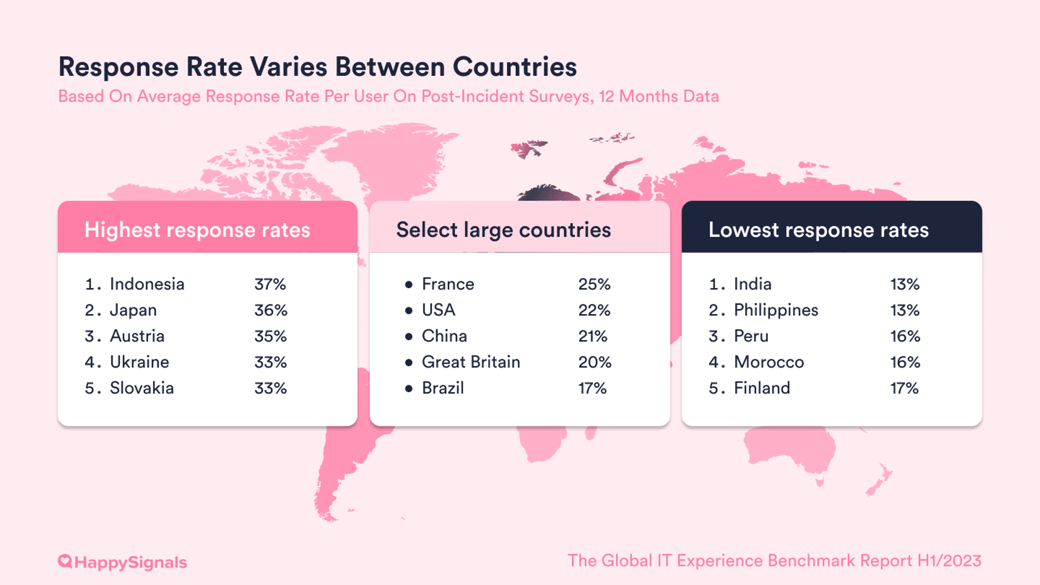
In simple terms, if the survey recipient doesn't believe the response to make a difference, then the motivation to fill out the survey will be low.
McKinsey studied this in more detail in this article, and they concluded:
"A common belief is that survey fatigue is driven by the number and length of surveys deployed. That turns out to be a myth. We reviewed results across more than 20 academic articles and found that, consistently, the number one driver of survey fatigue was the perception that the organization wouldn't act on the results."
Therefore, when looking at response rates across different countries, consider if the end-users in low response rate locations feel that their voice matters as much as those in high response rate countries.
Looking at experiences across industries, we can see clear differences in both the experience and the types of end-users represented. The numbers below reflect the happiness and lost time when incidents get resolved, and the end-users profile types reflect the IT skills and support preferences.
Users in the financial and insurance sectors report high satisfaction and minimal disruption. This hints at an IT support system that's both efficient and responsive. This is not surprising as the professionals in these industries can often be people with high salary costs matching high-value creations for their employers.
The story changes when we turn to the technology industry. Despite being in an industry centered around tech, users there report the lowest levels of happiness and the longest wait times. This could reflect the complex nature of their IT issues or higher expectations for service. Tech professionals might benefit from a more nuanced IT support approach that caters to their specific challenges.
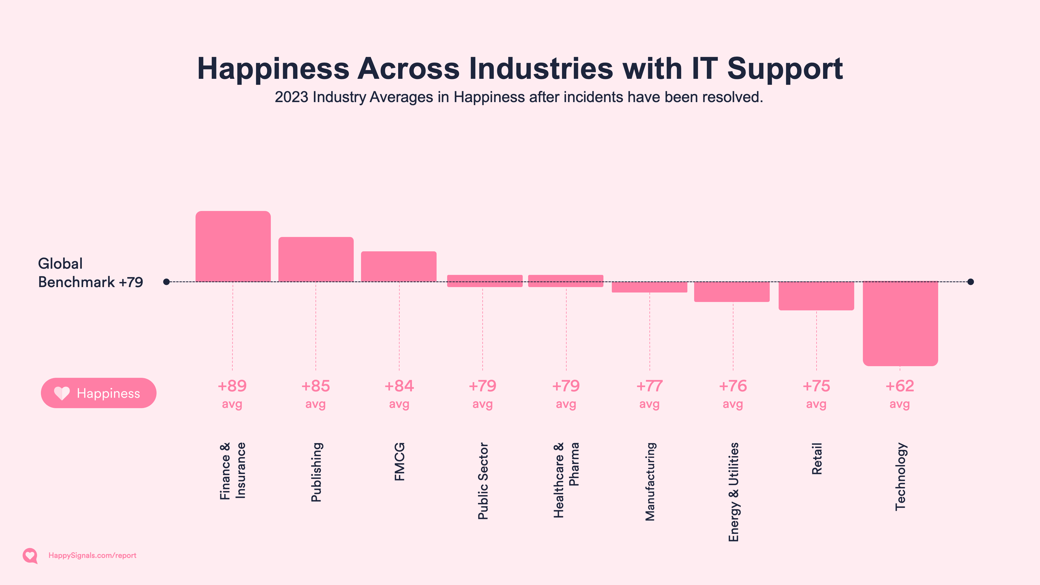
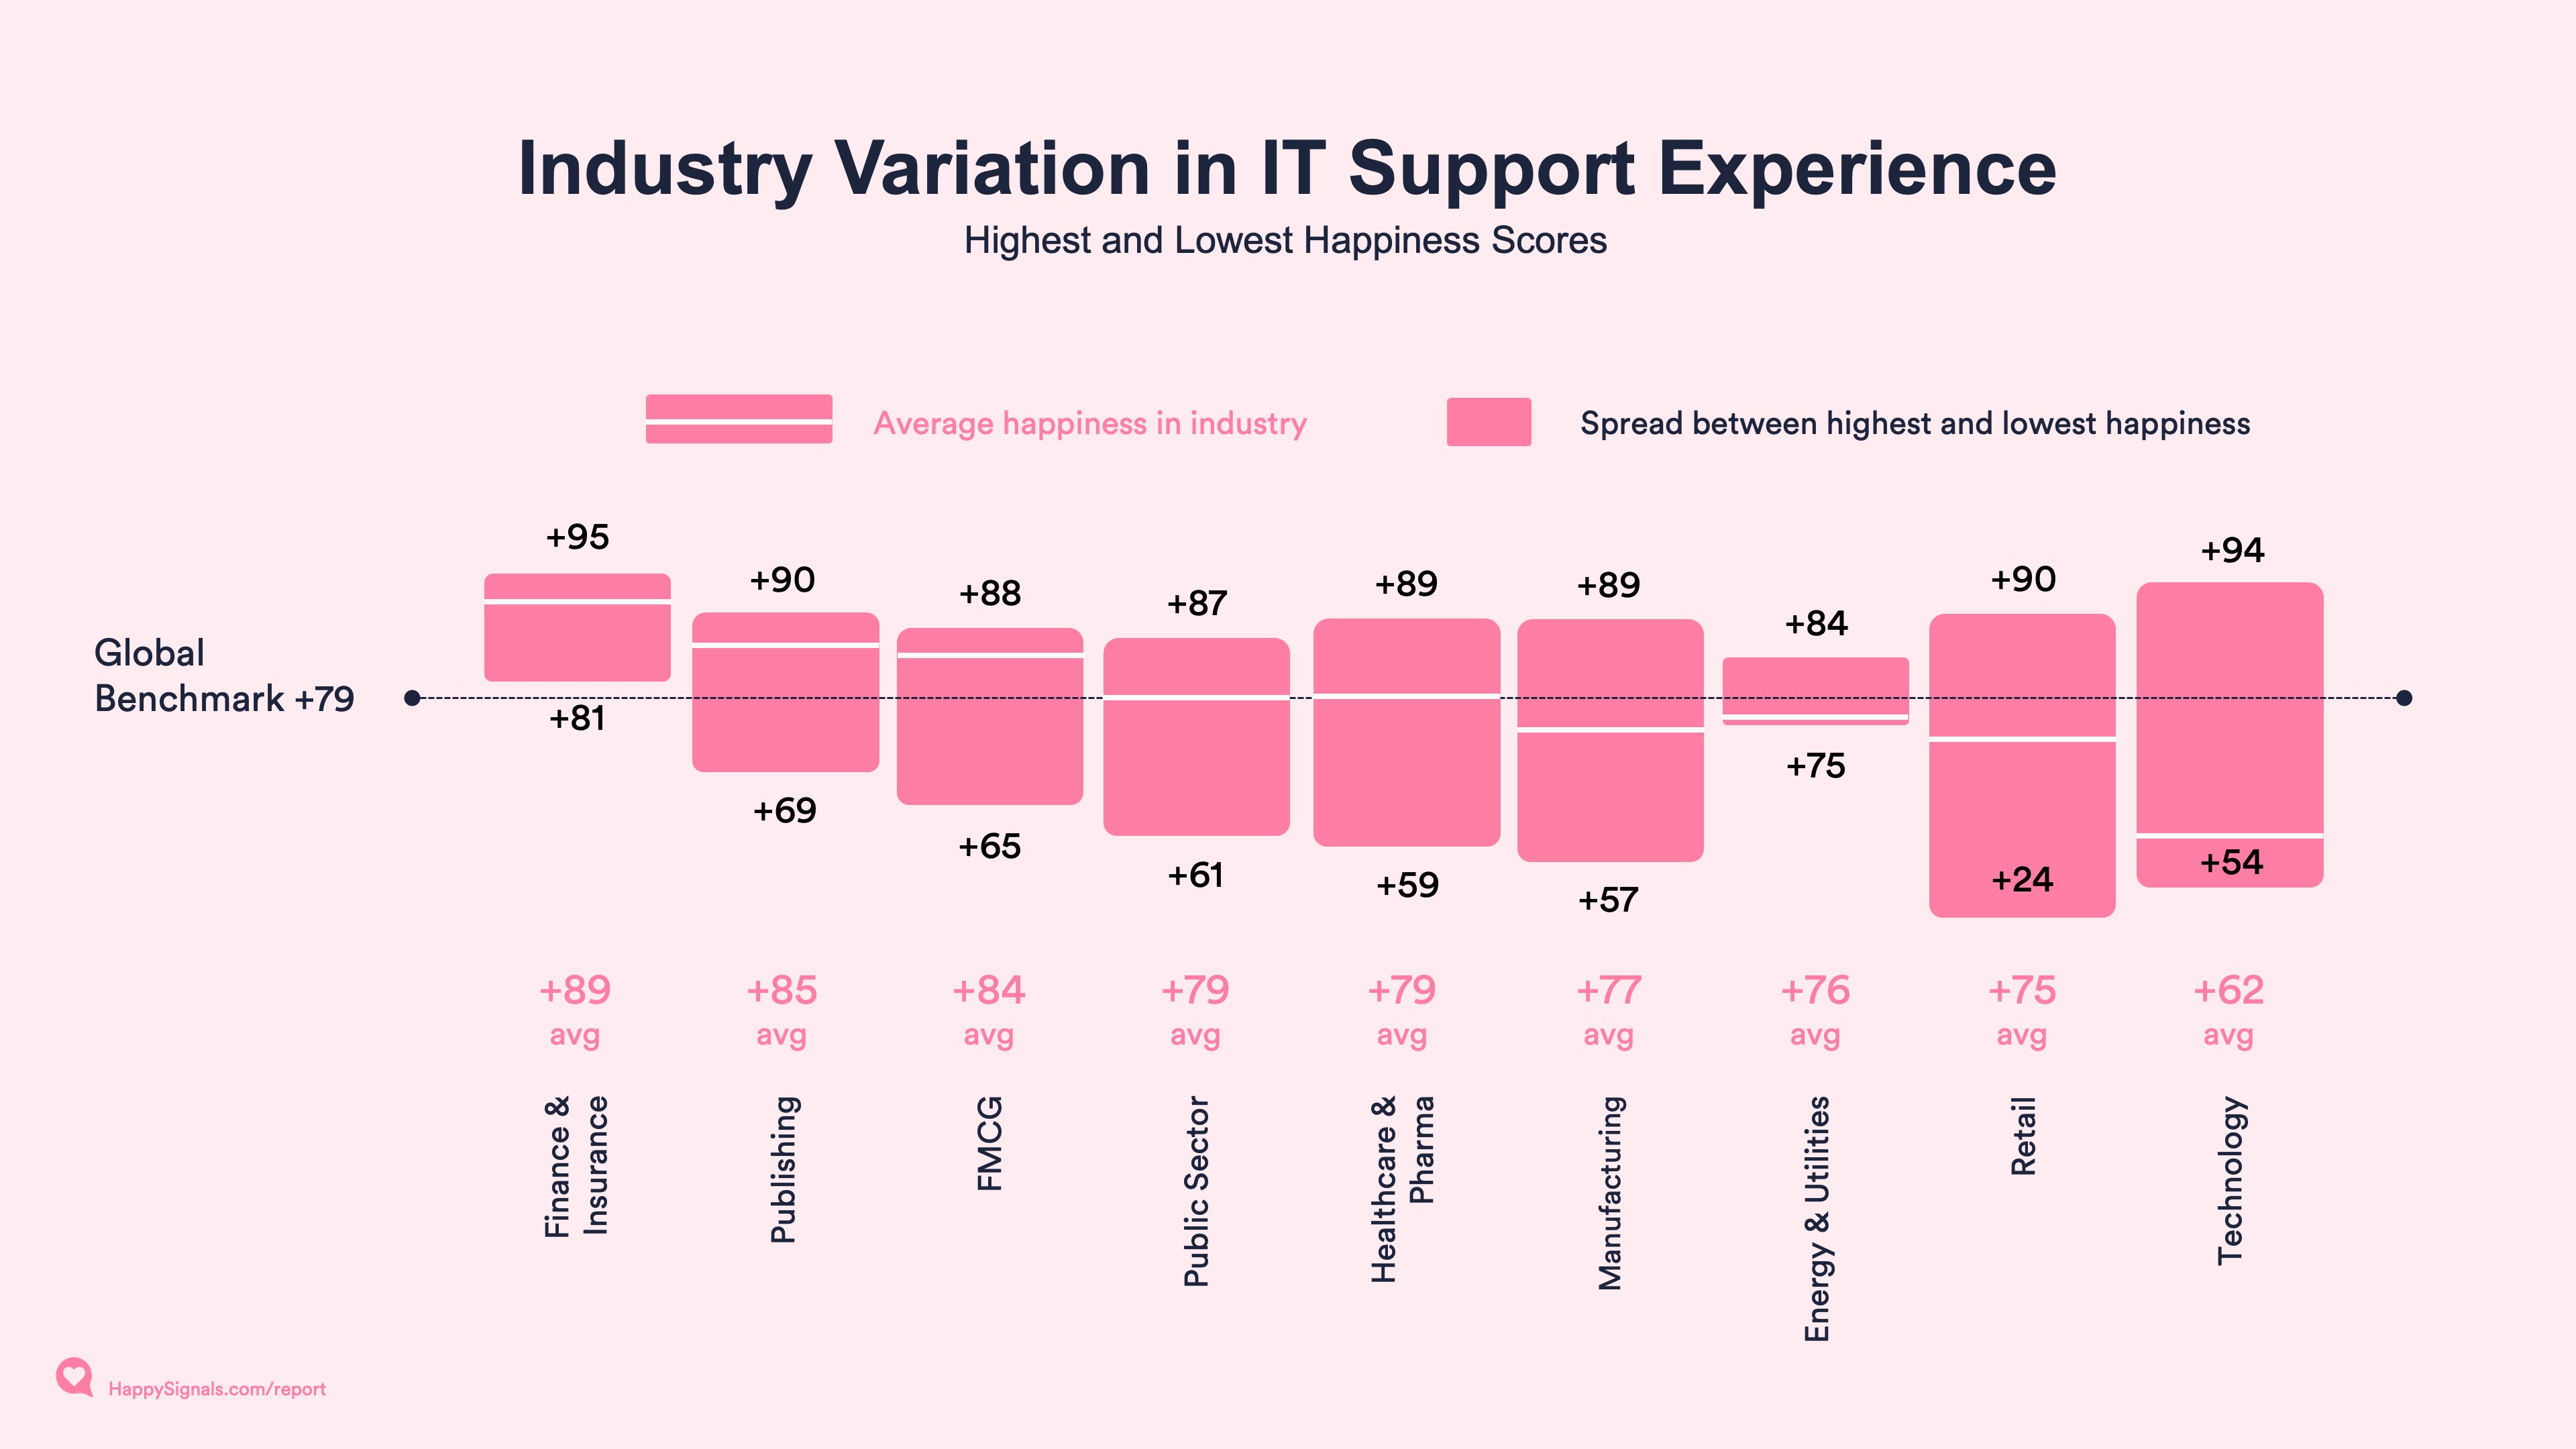
The differences in happiness across industries are, to varying degrees, industry-specific. The spread between the highest- and lowest-scoring organizations varies in specific industries.
The average score indicated in the image above is represented by the darker pink line in the graphic below.
What we observe when looking at the spread is variation between the very homogenous Energy & Utilities, compared to Manufacturing, where experience is evenly distributed between different companies.
If you see the darker pink industry average line close to either end of the lighter pink box, it means that most experiences are at that end of the scores.
A good example is the technology sector, where we find a few exceptionally performing companies with average happiness of more than +90, while most end-users in the industry are much closer to +60.
We see distinct patterns in how users prefer to handle IT troubles. Public sector employees stand out as self-sufficient 'Doers,' preferring to solve problems themselves. On the other hand, retail has more end-users who lean heavily on IT services, with many being 'Prioritizers'—skilled yet choosing to delegate to specialists. This difference underscores the importance of IT support being adaptable to different working cultures.
The 'Supported' group—those less confident in their tech abilities and more reliant on IT help—is the largest in the FMCG industry. Meanwhile, 'Triers'—those who try fixing issues before asking IT for help—are slightly more common in FMCG and Healthcare and Pharma.
Understanding the differences among industries is a higher-level view, but in all of these industries, the variations within the company's different roles and locations are likely to present even higher variations.
| Industry | Happiness | Lost Time | Doer | Prioritizer | Supported | Triers |
| Global Benchmark | +79 | 3h 12min | 53% | 24% | 16% | 8% |
| Finance & Insurance | +89 | 2h 0min | 53% | 22% | 17% | 8% |
| Publishing | +85 | 2h 11min | 59% | 19% | 14% | 8% |
| FMCG | +84 | 3h 26min | 42% | 28% | 22% | 9% |
| Public Sector | +79 | 2h 12min | 62% | 22% | 10% | 5% |
| Healthcare & Pharma | +79 | 3h 38min | 55% | 21% | 15% | 9% |
| Manufacturing | +77 | 3h 27min | 52% | 25% | 16% | 7% |
| Energy & Utilities | +76 | 2h 57min | 63% | 21% | 10% | 6% |
| Retail | +75 | 3h 13min | 56% | 30% | 9% | 4% |
| Technology | +62 | 3h 56min | 65% | 20% | 9% | 6% |
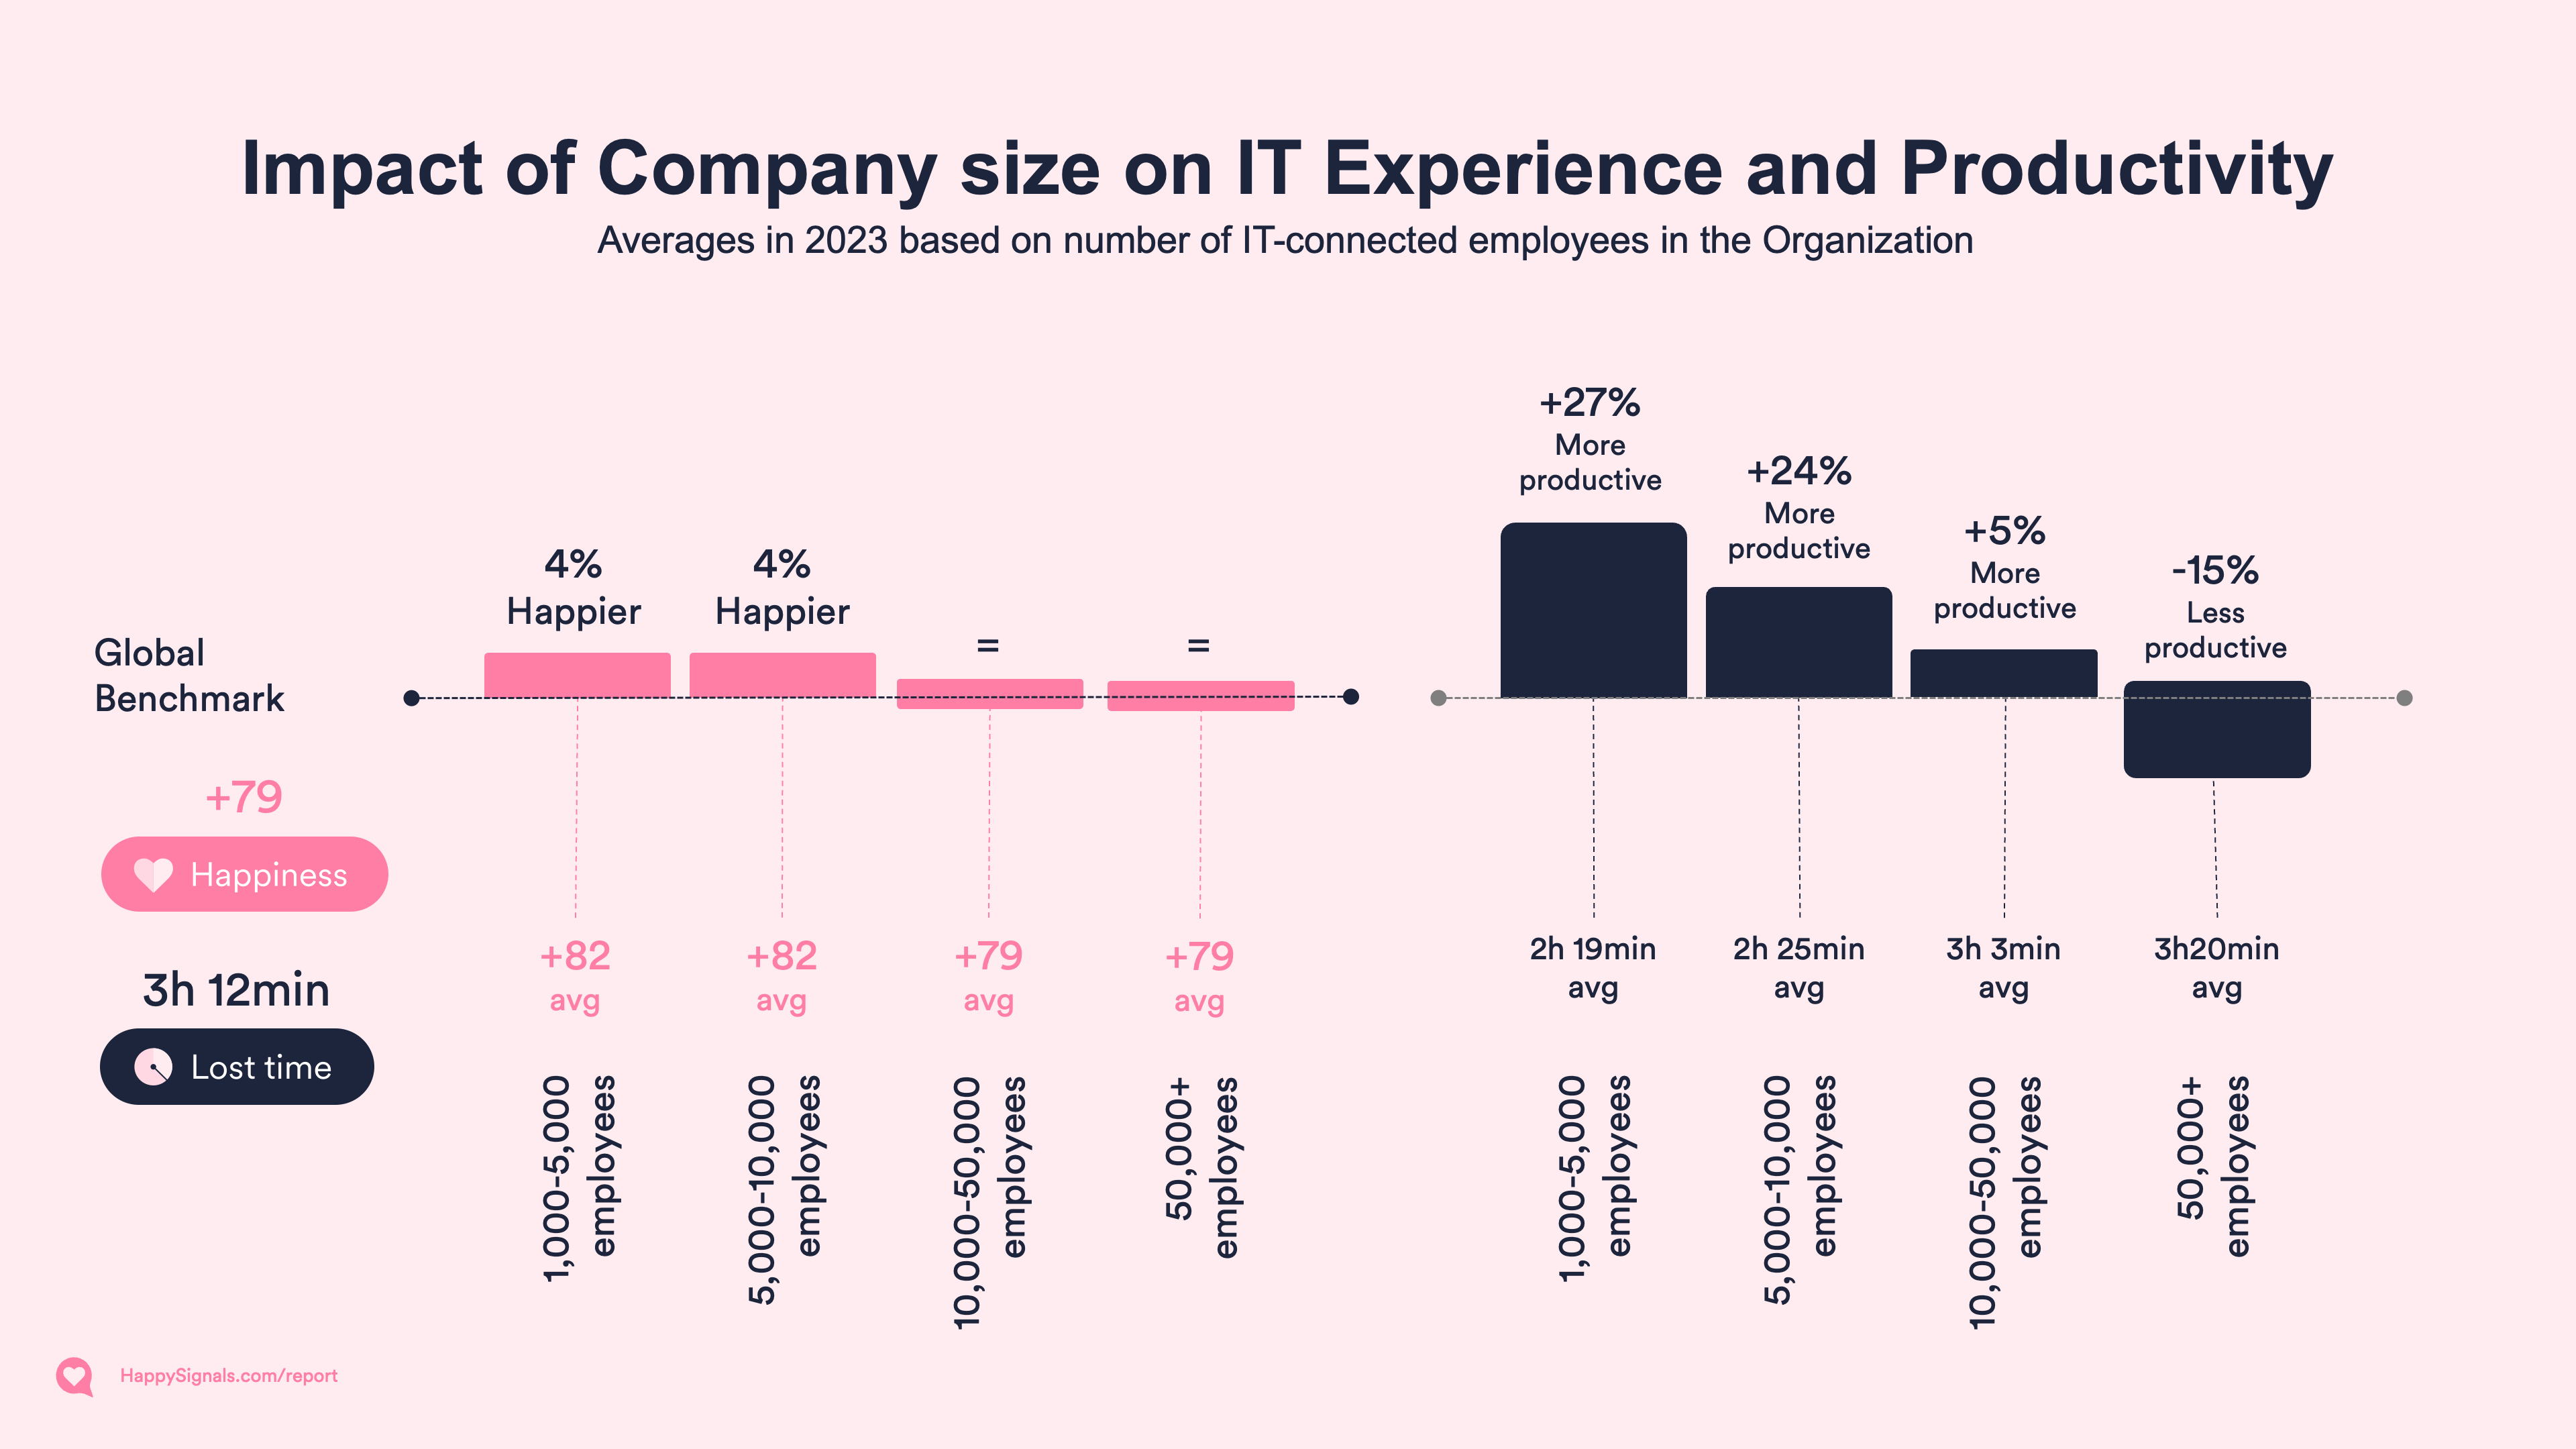
The study of differences in experience between different company sizes is (in this report) limited to data collected after incident resolutions. This allows for a study with the widest available set of data, comparable processes, and expected outcomes at the end of the process.
The number of employees in an organization has less impact on happiness than in our previous research a couple of years ago. The difference is, at most, 4%, which represents +3 points in happiness compared to the Benchmark. While happiness does not vary much, the perception of lost time with each incident does.
The larger the company, the more time end-users perceive losing with each incident. Comparing the smallest organizations to the largest ones, the employees of smaller enterprises perceive losing 1 hour less per incident than the employees of the largest organizations.
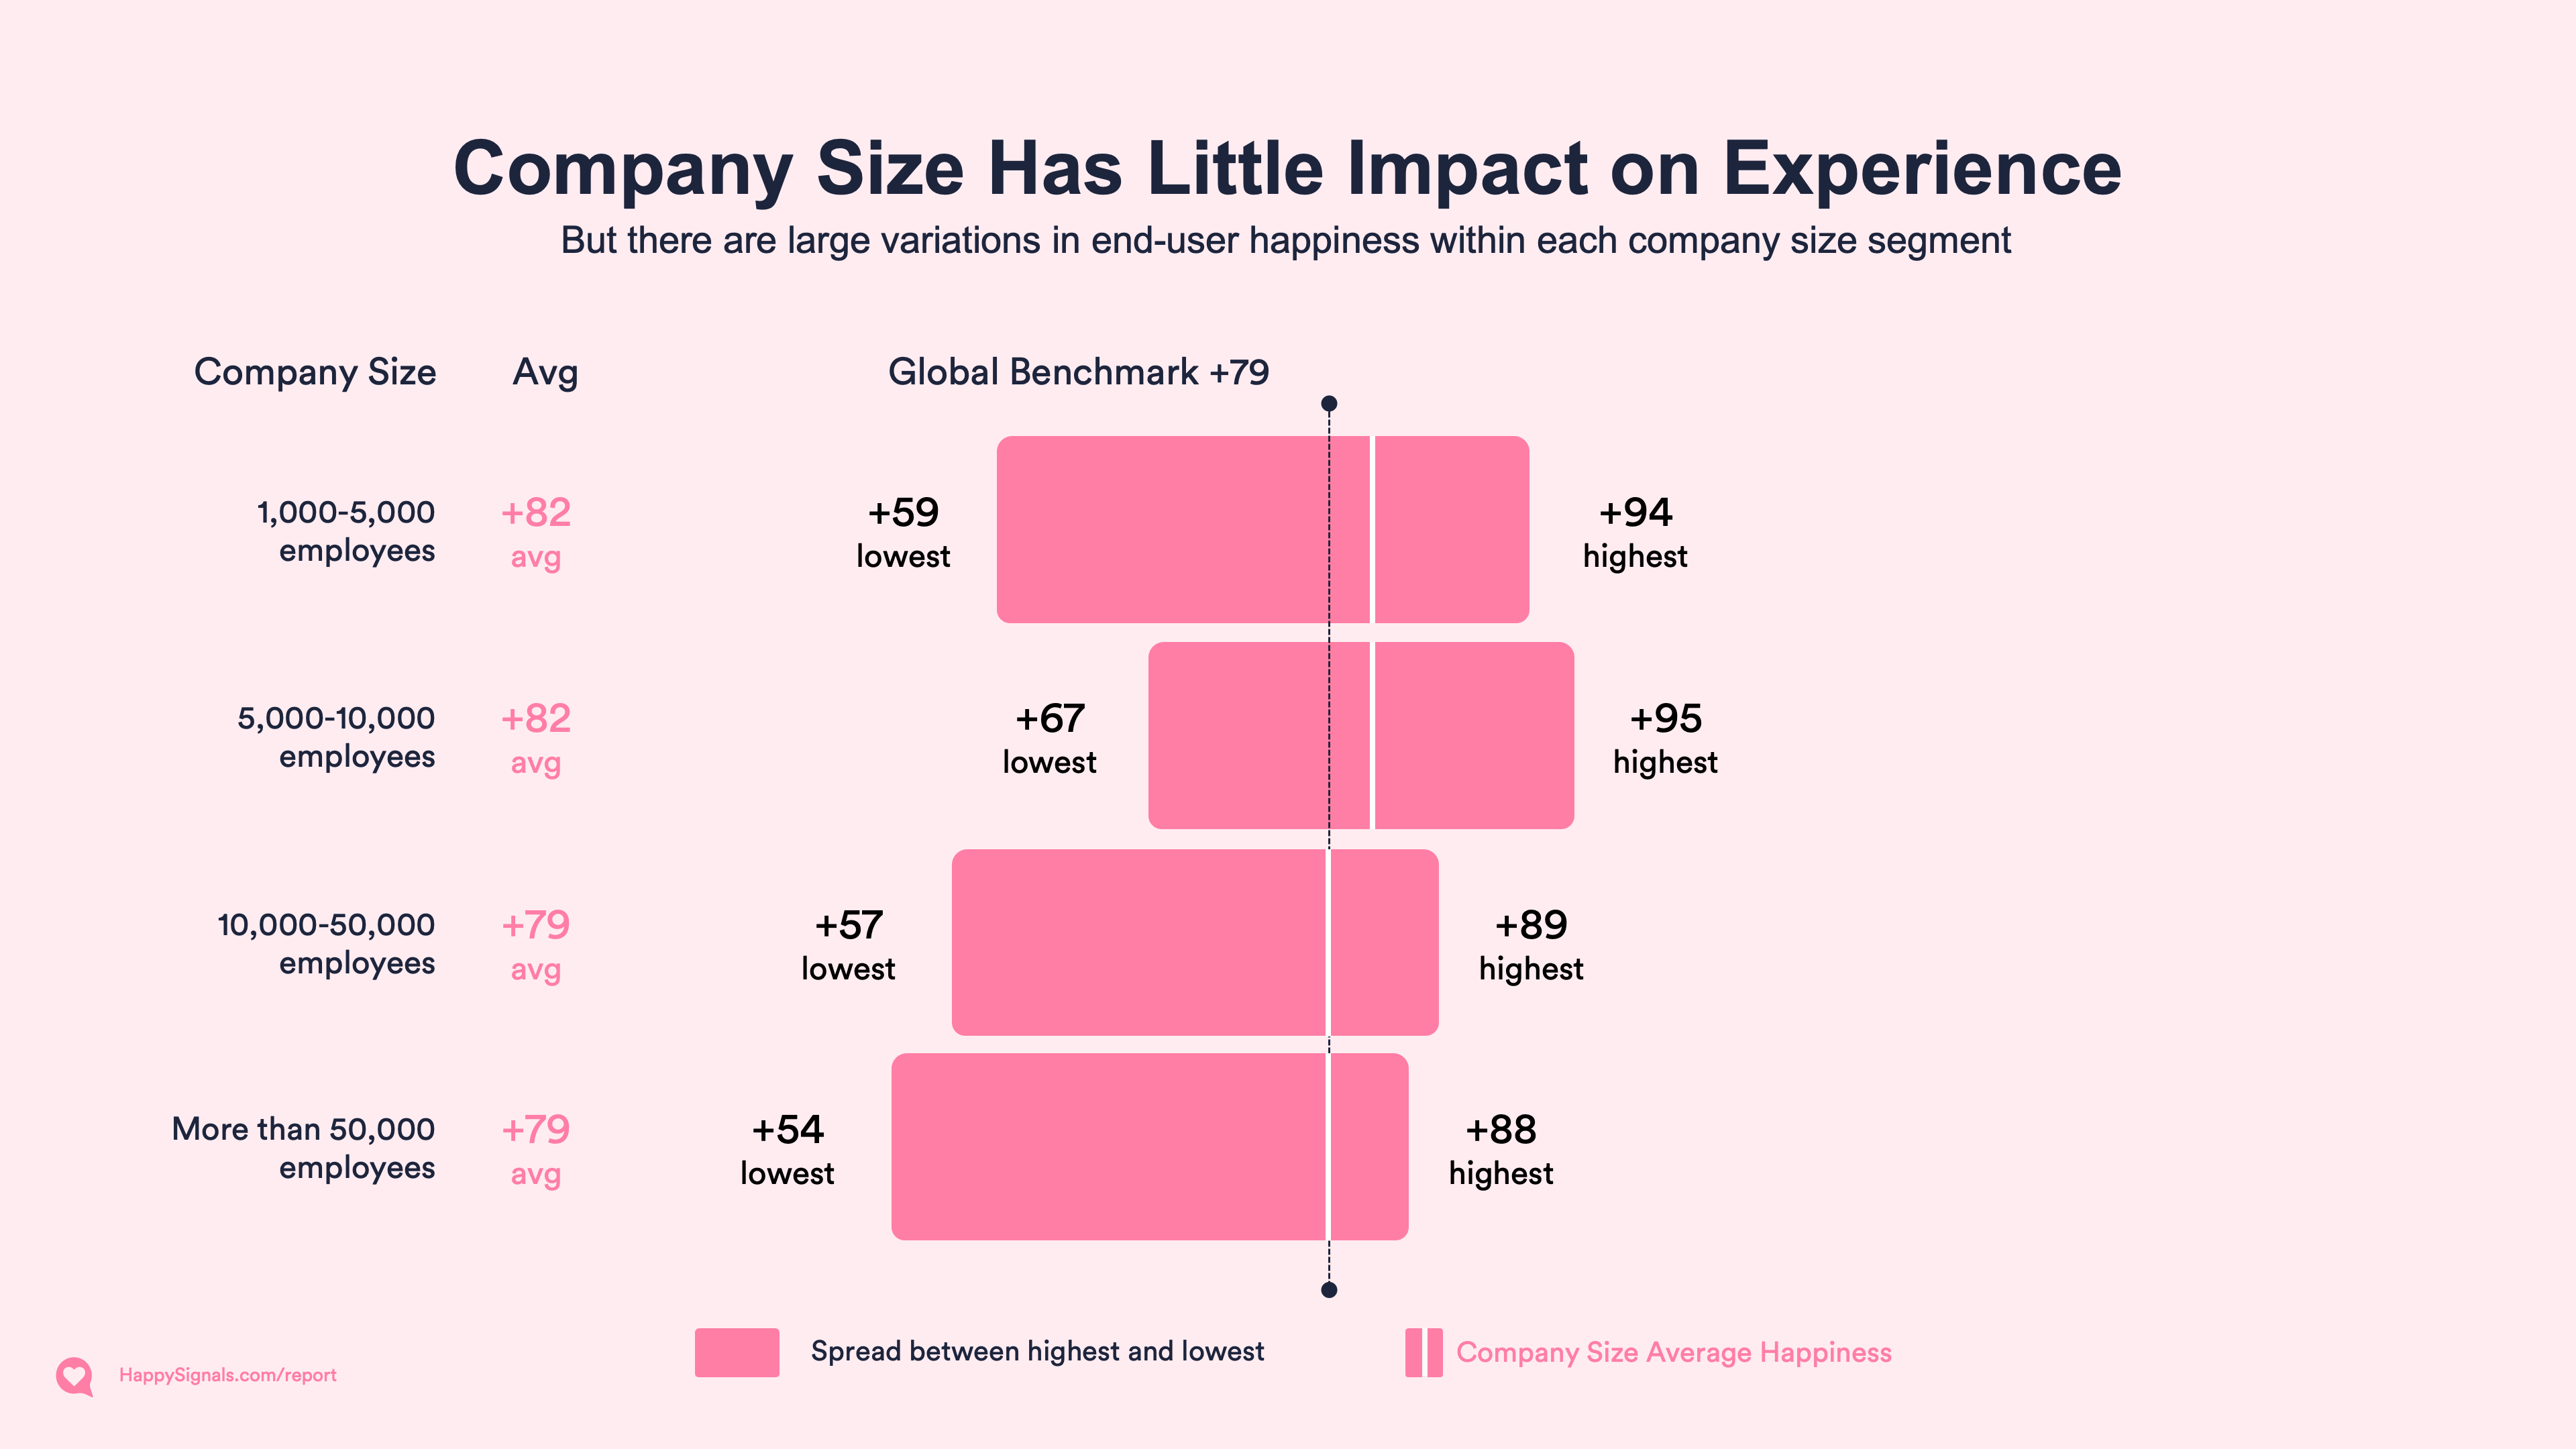
While happiness hardly varies between the company sizes on a global scale, each size category has varying degrees of spread in happiness between the highest and lowest-scoring companies.
The highest-scoring companies are found in the smaller company sizes, while the lowest-scoring companies are found in the largest ones.
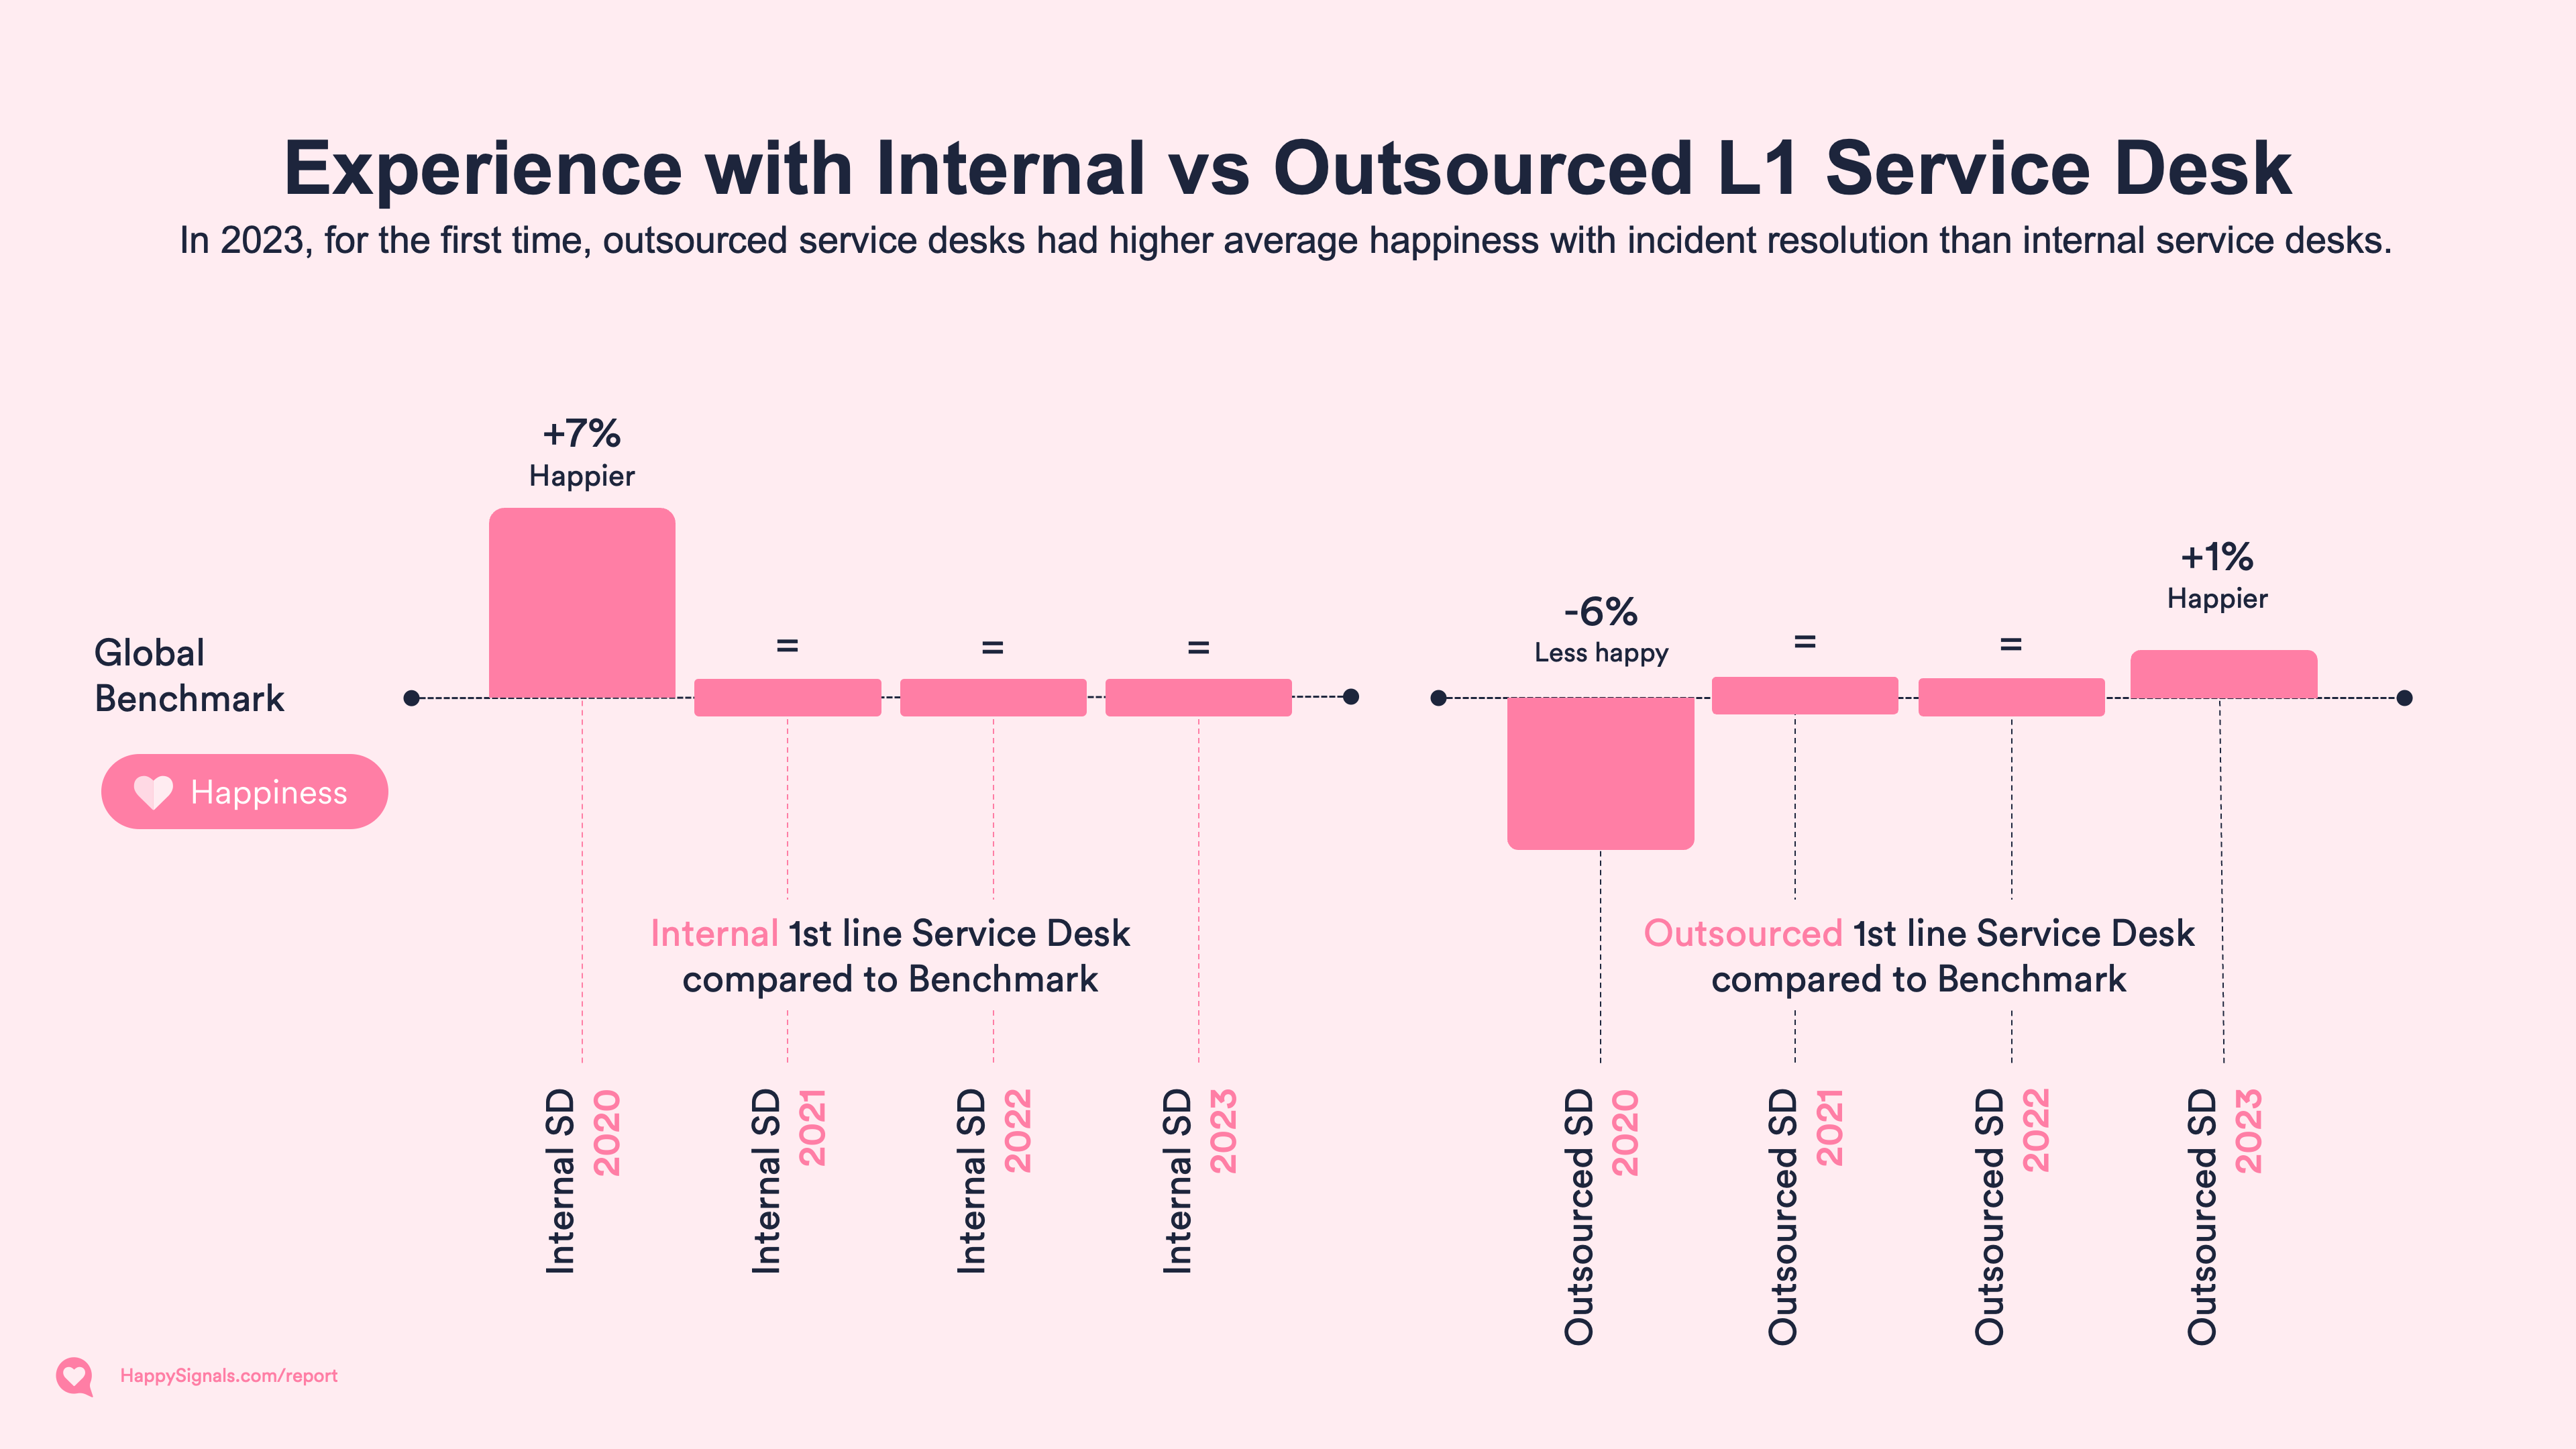
In our earlier Benchmark reports, we found that Internal service desks were able to outperform their outsourced peers in happiness. At the same time, our findings showed that outsourced service desks were often more systematic in using experience data and improved faster than internal ones.
Looking at the happiness year-to-year, we can now see that outsourced service desks have marginally happier end-users than internal ones. The average score for outsourced service desks in 2023 is +80, while internal service desks are on par with the benchmark at +79.
The happiness scores show that in terms of end-user experience with the service, outsourced service providers can provide on par or better experience for end-users. Well done!
| Happiness with incident resolutions | 2020 | 2021 | 2022 | 2023 |
| Internal L1 service desk | 77 | 76 | 77 | 79 |
| Outsourced L1 service desk | 68 | 76 | 77 | 80 |
| Lost time with Incidents | 2020 | 2021 | 2022 | 2023 |
| Internal L1 service desk | 2h 18min | 2h 27min | 2h 29min | 2h 24min |
| Outsourced L1 service desk | 3h 52min | 3h 19min | 3h 35min | 3h 30min |
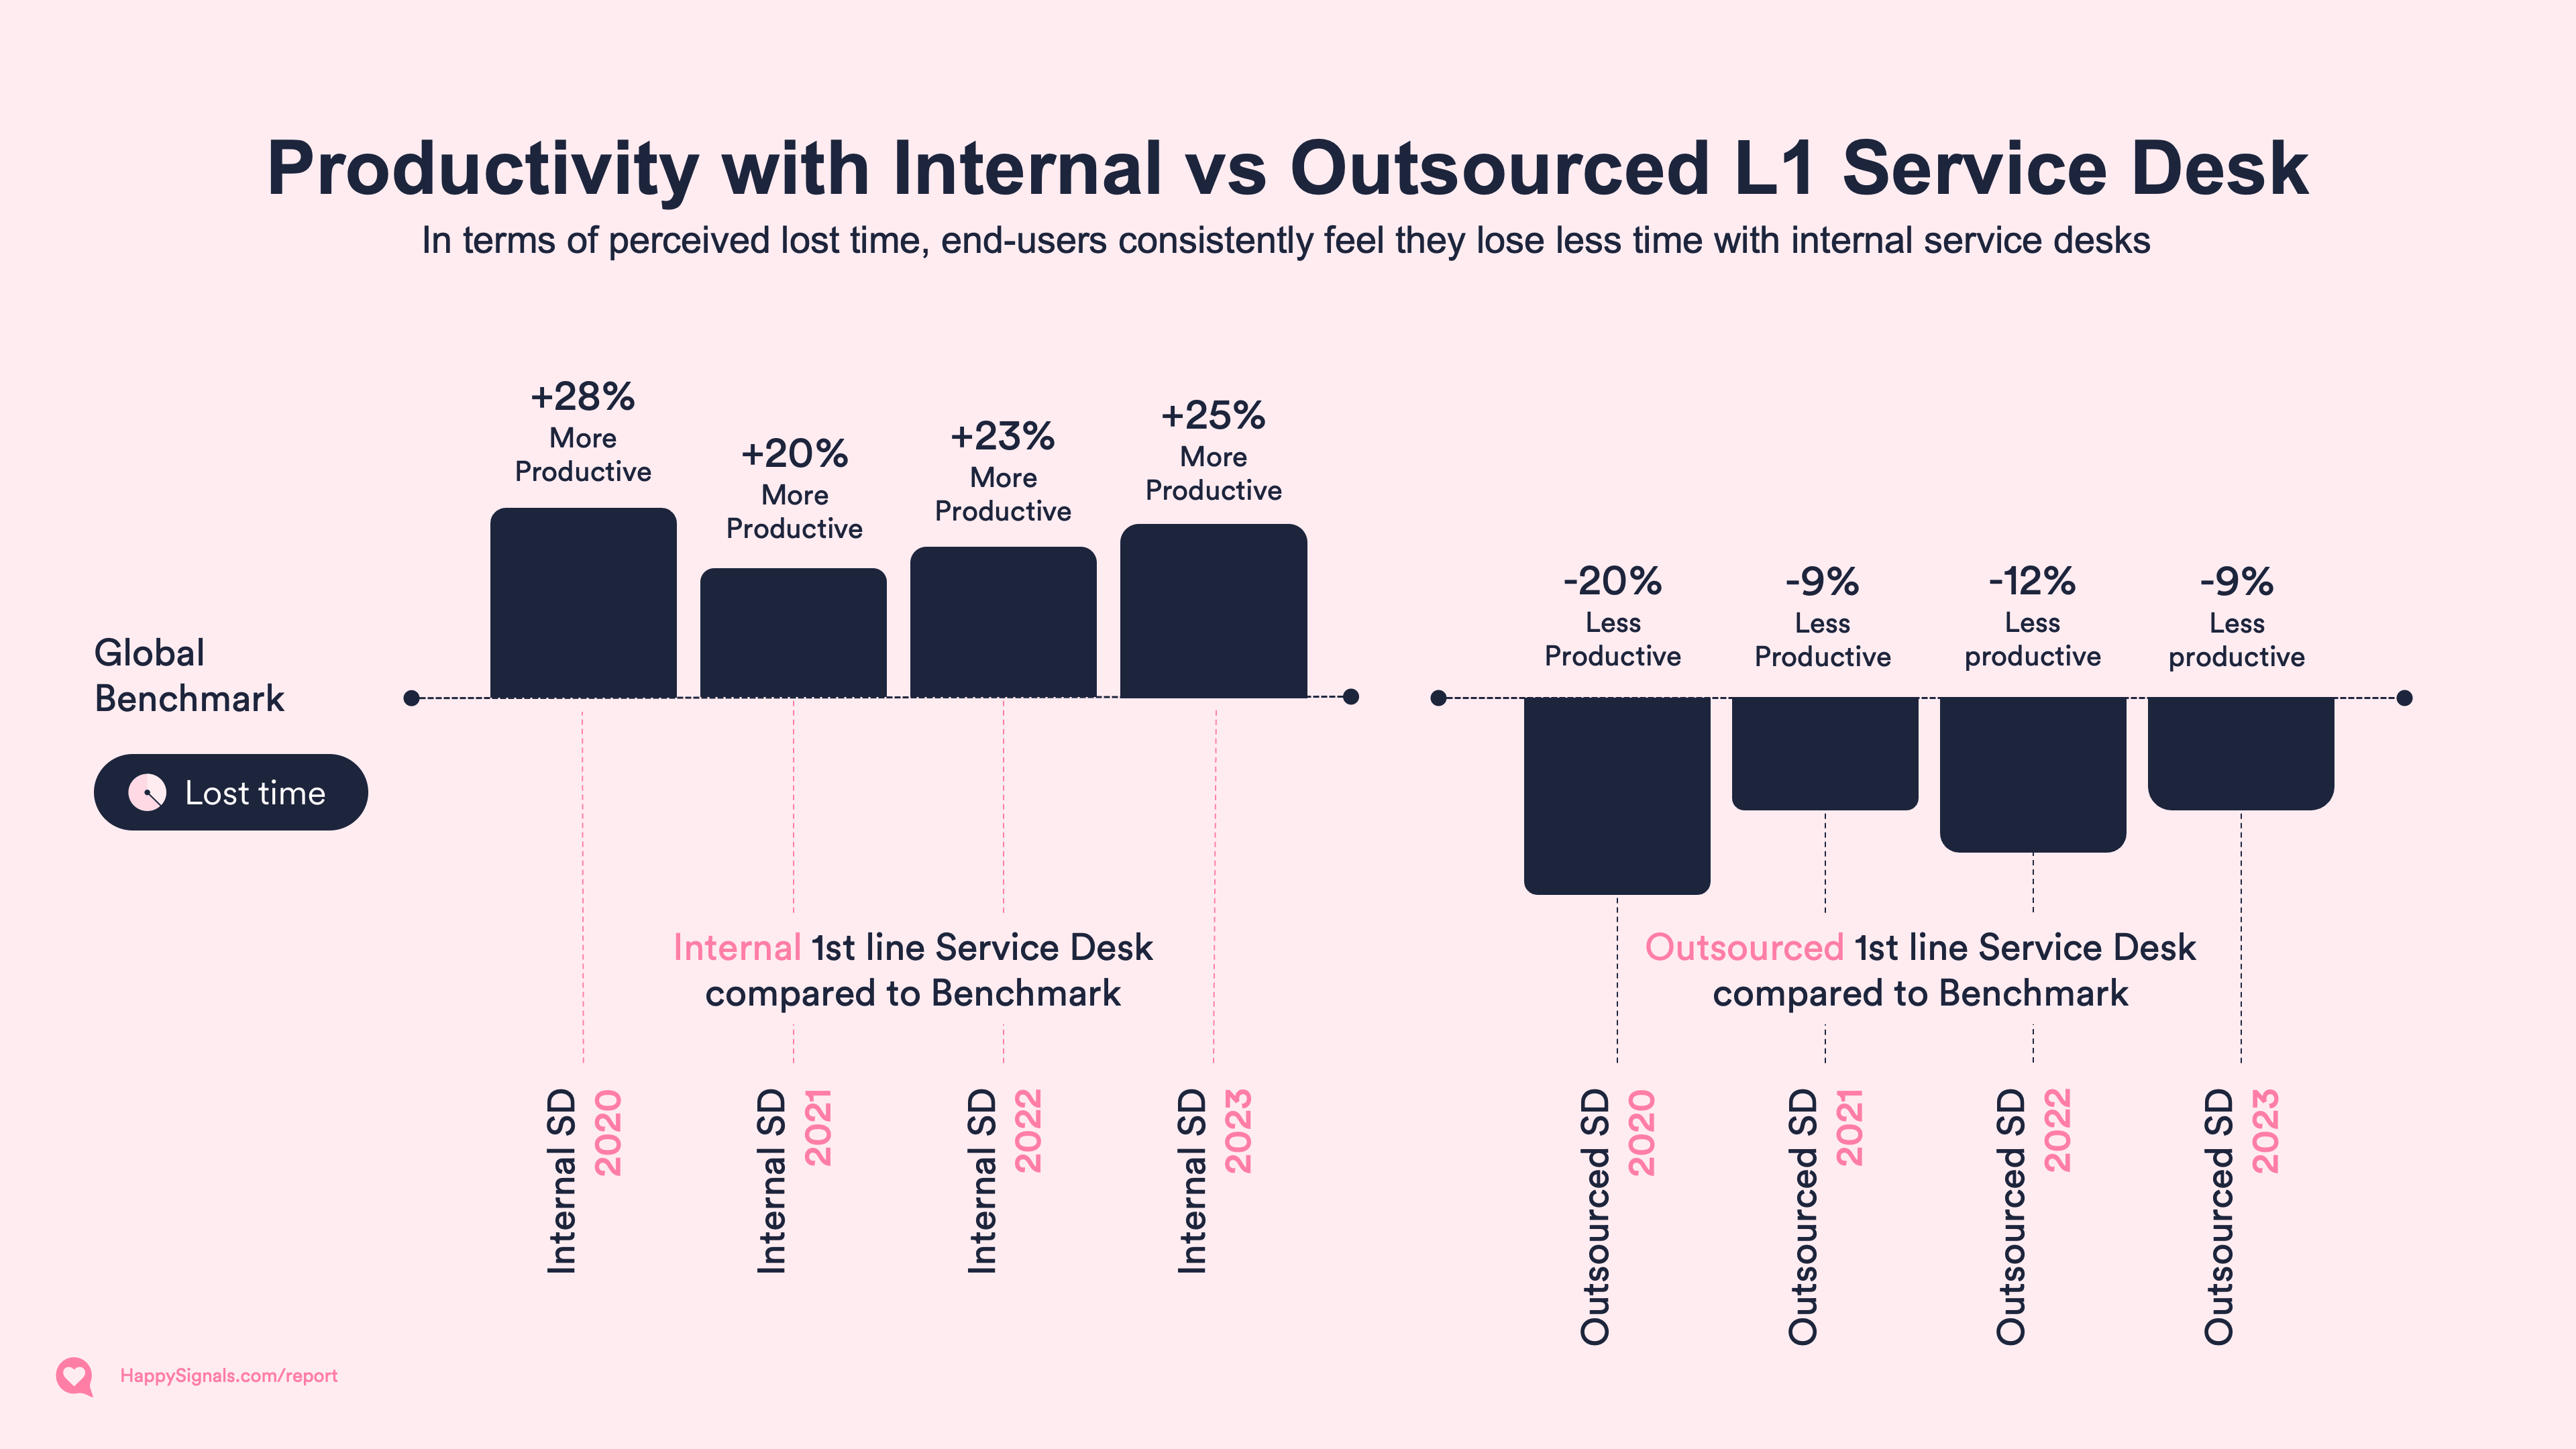
The results, on the other hand, are a bit more nuanced when we look at lost time. For some reason, the perception of lost time is systematically around 1 hour more with outsourced service desks, and has been so for the last 3 years.
The interesting observation here is that internal service desks are managing to slightly improve the productivity of end-users every year compared to benchmark, while outsourced service providers are slightly more up and down in their averages.

Incidents and requests
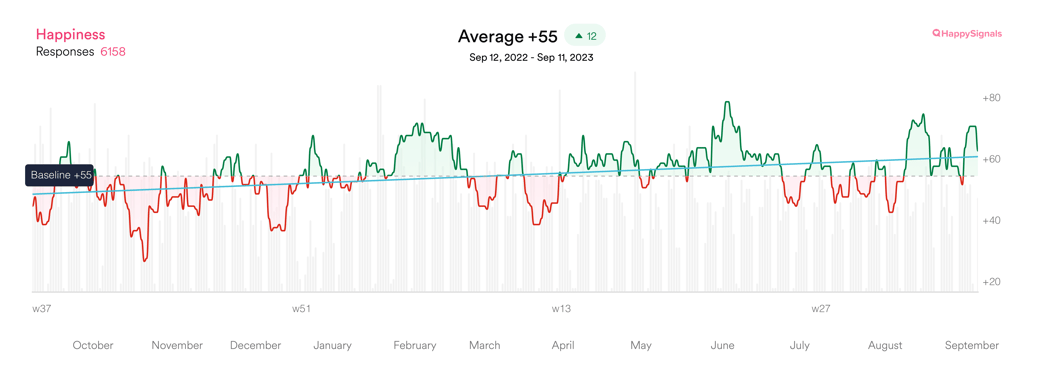
The explanation for the stable average happiness in our Benchmark report might feel like experience management stagnates at some point and improvements become increasingly hard to find, but the overall average hides the fluctuations over time in customer data. Most customers manage to progressively improve their happiness scores and decrease their lost time. Getting there, however, is a dynamic journey with ups and downs.
The evolution of happiness and lost time over the years seems counterintuitive at first. How can organizations that focus on IT experience see increases in lost time with each incident and request?
Historically, CSAT scores were "artificially" boosted with easy tickets. If CSAT dropped overall, the service desk could always solve more easy tickets that would almost guarantee to be quick and highly rated. Cherry-picking easy tickets from the queues while avoiding the difficult ones is good for growing watermelons but not for real end-user experience improvements.
We have always advocated for more smiles, less time wasted. Automating easy tickets as much as possible frees up time to focus on the more difficult tickets where people lose more work time.
Automating easy tickets while assigning sufficient resources for difficult tickets has the interesting effect of increasing happiness and lost time. While this can look negative on the surface, it can also mean that harder tickets are taken care of in a way that makes end-users happy, even if they lose more time in that interaction.
Once again, the actionable and valuable insights in experience data often come from the deeper drill-down analysis that leads to otherwise undetected issues.
End-user's experience data can and will point out areas of IT that other metrics do not manage to capture.
| Happiness and Lost time with Ticket-based IT | 2019 | 2020 | 2021 | 2022 | 2023 |
| Incidents, Happiness | +65 | +72 | +76 | +77 | +79 |
| Incidents, Lost Time | 3h 14min | 3h 13min | 3h 3min | 3h 13min | 3h 12min |
| Requests, Happiness | +75 | +77 | +80 | +82 | +84 |
| Requests, Lost Time | 2h 28min | 1h 36min | 2h 52min | 2h 59min | 3h 16min |
The graph below is from one of our customers who started their IT Experience Management journey in September 2022. They have managed to improve their end-user experience in the first year, but as you can see, experience is dynamic. It changes daily, and understanding the dips and peaks allows IT to improve, step-by-step, improvement by improvement.
The definition of lost time: End-users estimate how much work time they lost due to the service experience.
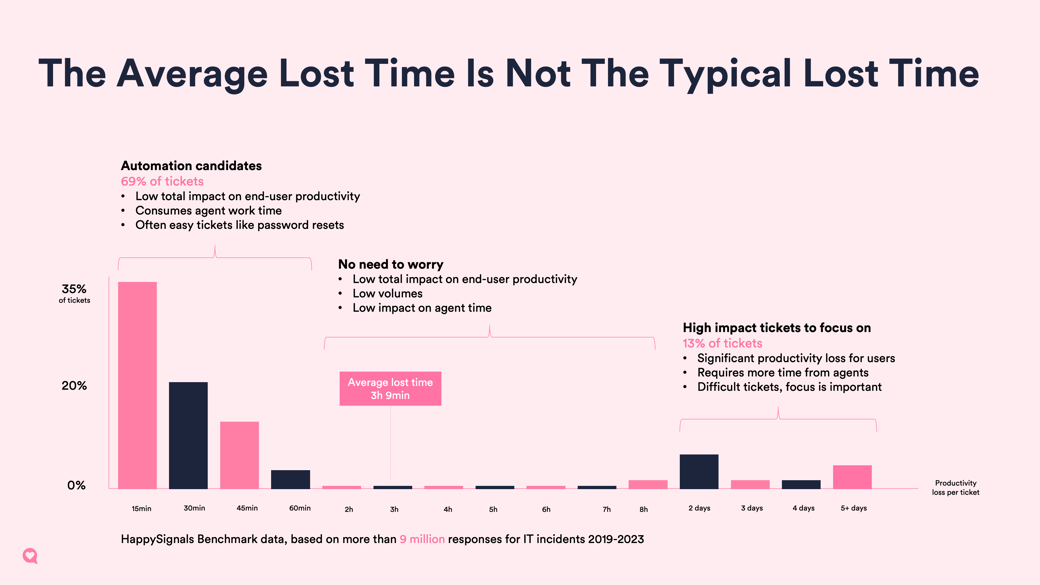
When we examine how much work time people think they lose due to IT issues, it’s clear that there's a big difference between incidents. While most issues are resolved quickly, a small percentage of issues (13%) take a lot longer to fix. These few, more time-consuming cases account for most of the total time lost (80%). Over the years, we've seen that the fast-resolving incidents are getting resolved quicker, but the ones that take more than eight hours are dragging on for even longer. This widening gap is why, despite faster resolutions for many, the overall average time lost has been increasing in recent reports. It’s the longer delays for a few that push up the average, as those few incidents lead to much more time lost than the rest.
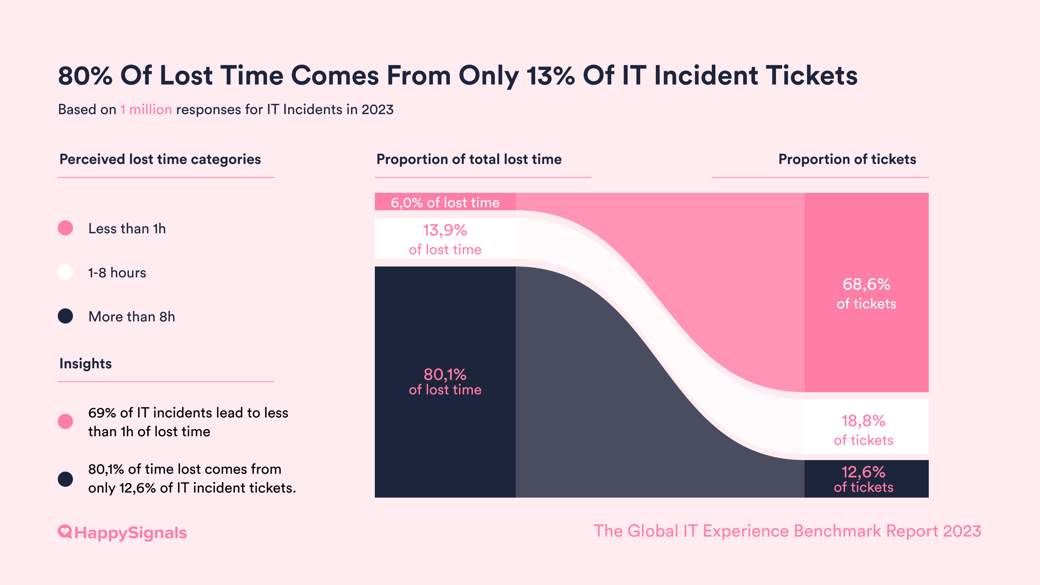
When IT identifies where end-users are losing time, they will find improvement opportunities that greatly impact every issue that gets solved. Understanding where people lose only small amounts of productive work time allows IT to identify automation candidates that would liberate time from agents to solve more complicated issues.
To improve IT services, it's important to understand why users are unhappy with the help they receive when they report incidents. From this report onwards, we show the main reasons for complaints as a percentage of all the tickets where users have mentioned specific issues.
For instance, when users give a bad score, 51% say it's because "My ticket was not solved," but overall, this issue is mentioned in just 3.6% of all feedback. However, the total time lost due to these unresolved tickets is disproportionally high compared to their number. This data on user satisfaction and time lost helps IT departments decide where to focus their efforts for the biggest impact rather than just looking at general satisfaction levels.
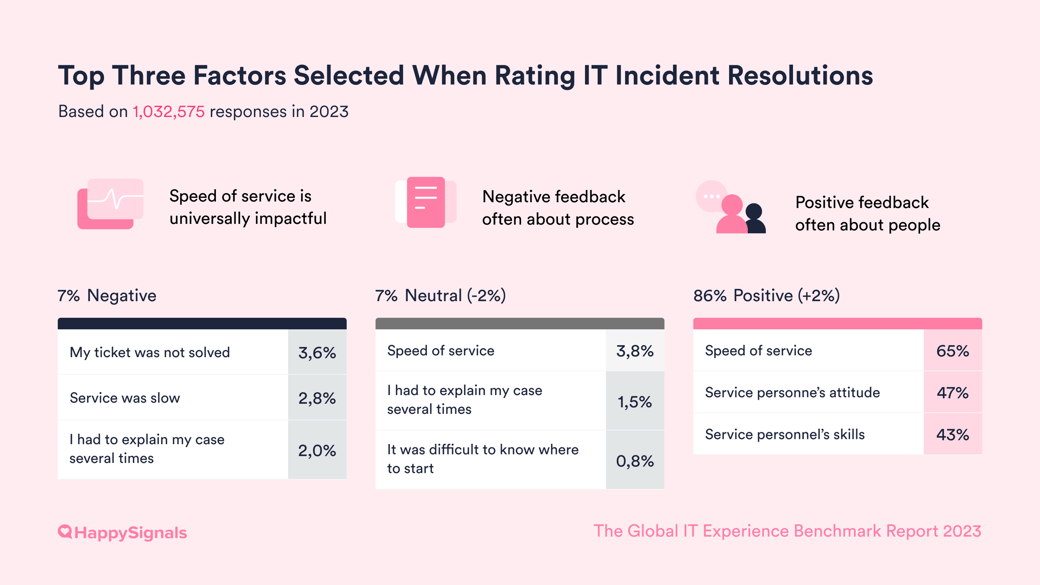
The factors are selected from a research-backed list of Factors. We ask end-users to select the factors that best reflect their satisfaction or dissatisfaction with the service in a survey sent to them after a ticket resolution.
Different factors are presented to end-users depending on their happiness rating on a 10-point scale, and they can select as many factors as they wish from the list. Factors related to service agents are included in all three scenarios of negative (0-6), neutral (7-8), and positive (9-10) experiences. Each percentage for a factor represents the proportion of responses in which at least one factor was selected.
The factors that create positive, neutral, and negative experiences with IT Incidents for end-users remain very stable. The numbers do NOT reflect the total number of tickets, but the selected factors related to positive, neutral, or negative feedback.
| IT Incidents - Positive (86% of responses in 2023) | 2019 | 2020 | 2021 | 2022 | 2023 |
| Speed of service | 75% | 74% | 74% | 75% | 75% |
| Service personnel's attitude | 52% | 55% | 56% | 55% | 55% |
| Service personnel's skills | 48% | 49% | 50% | 49% | 50% |
| Service was provided proactively | 28% | 34% | 36% | 37% | 40% |
| I was informed about the progress | 29% | 33% | 35% | 35% | 37% |
| I learned something | 21% | 25% | 26% | 26% | 27% |
| IT Incidents - Neutral (7% of responses in 2023) | 2019 | 2020 | 2021 | 2022 | 2023 |
| Speed of service | 58% | 57% | 55% | 55% | 54% |
| I had to explain my case several times | 20% | 21% | 21% | 21% | 22% |
| It was difficult to know where to start | 11% | 11% | 12% | 12% | 12% |
| I wasn't informed about the progress | 11% | 11% | 10% | 10% | 10% |
| Service personnel's skills | 10% | 8% | 8% | 8% | 8% |
| Instructions were hard to understand | 7% | 7% | 8% | 8% | 8% |
| Service personnel's attitude | 7% | 6% | 7% | 7% | 6% |
| IT Incidents - Negative (7% of responses in 2023) | 2019 | 2020 | 2021 | 2022 | 2023 |
| My ticket was not solved | 40% | 46% | 47% | 49% | 51% |
| Service was slow | 47% | 44% | 44% | 43% | 40% |
| I had to explain my case several times | 29% | 30% | 29% | 30% | 29% |
| I wasn't informed about the progress | 16% | 16% | 16% | 16% | 16% |
| Service personnel's skills | 12% | 12% | 12% | 12% | 11% |
| Instructions were hard to understand | 7% | 8% | 8% | 8% | 8% |
| It was difficult to know where to start | 7% | 7% | 7% | 7% | 7% |
| Service personnel's attitude | 6% | 7% | 7% | 7% | 7% |
In service delivery, IT teams must also develop channels to enhance end-user satisfaction. To create channels that improve employee happiness, it's essential to obtain reliable and detailed experience data about how end-users utilize and perceive different channels.
Without acquiring and utilizing this data, IT teams may mistakenly allocate resources to add new channels unnecessarily, encourage end-users to use them, or focus on improving channels already performing well instead of those requiring attention.
Our channel usage data reflects the recent trend in the IT service management (ITSM) industry of developing channels with automation and predefined user flows to reduce the workload on service desk agents. This trend is expected to continue as IT organizations strive to improve efficiency while enhancing the overall customer experience. Investments in service portals, smart AI-powered chats, and proactive monitoring of services with self-healing capabilities all aim to optimize the use of technology across different teams.
However, we advise against losing sight of end-user needs by continuously monitoring how their experience changes when support channel recommendations and usage are modified. If possible, establish a baseline for experience data before the change, track changes during the transition, and draw conclusions by assessing the experience a few months after implementation.
Note that the total percentages don't add up to 100% because we exclude channel categories that cannot be accurately categorized into the existing five categories.
Based on the data from all our customers, there are only slight differences in overall happiness with the digital channels – Chat, Email, Phone, and Portal (all range from +75 to +82). The only channel with significantly higher happiness is Walk-in (+94). The perception of lost time is also by far the lowest for Walk-in IT support, with just 1h 24min on average per incident, 1h less than the second least time-consuming channel, Phone.
See the latest six months of data about Happiness and Lost time per channel, combined with a table about how the use of channels has evolved over the last five years.
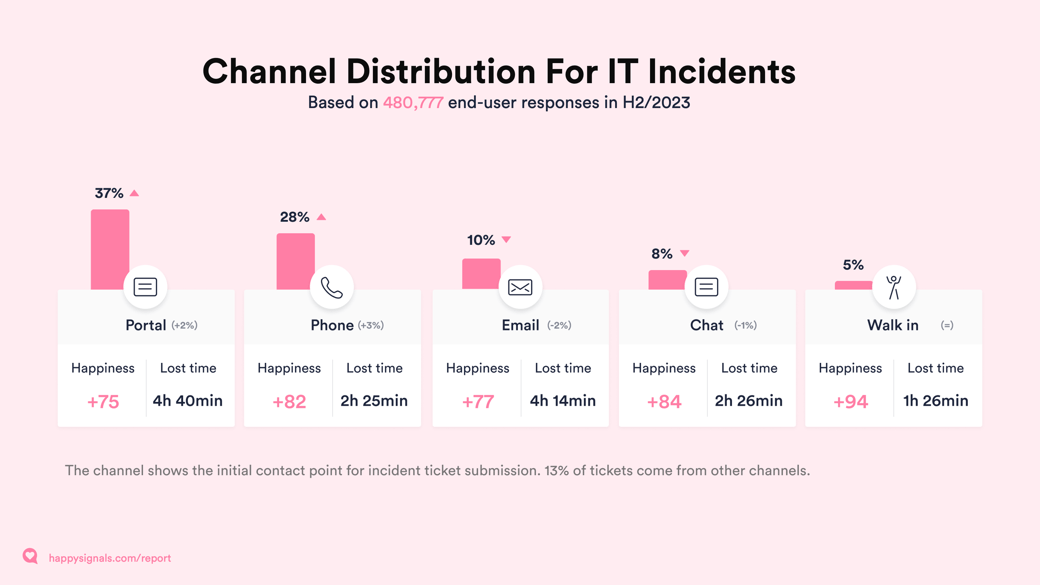
While the proportion of "other" channels is increasing steadily, the comparison below gives a good view of how the five selected channels have evolved in relation to each other. As a reader, you can consider these traditional IT support channels that still represent almost 90% of all raised tickets.
One of the most interesting observations here is how walk in as a channel has now returned to pre-pandemic levels. The proportion of tickets submitted through email has on the other hand nearly halved since 2019.
| Channel usage for IT Incidents | 2019 | 2020 | 2021 | 2022 | 2023 |
| Chat | 8% | 10% | 9% | 10% | 9% |
| 20% | 19% | 17% | 16% | 12% | |
| Phone | 31% | 32% | 29% | 27% | 30% |
| Portal | 34% | 36% | 41% | 42% | 43% |
| Walk in | 6% | 3% | 4% | 5% | 6% |
Each time a ticket is reassigned, end-user happiness decreases by more than seven points, and users lose an average of 1 hour and 46 minutes of work time, ranging from 0 to 4 reassignments. When a ticket is reassigned four times, it can result in a total loss of 9 hours and 8 minutes.
Our data, collected over the past four years, has shown consistent trends in the frequency of ticket reassignments and the corresponding impact on end-user happiness and lost time. Over the years, the amount of time end-users lose with each reassignment has increased, while the amount of reassignments has decreased for most customers.
This is one of the areas offering the most potential for where IT Experience data can help IT teams get quick wins in increasing end-user productivity by ensuring incidents are directed to the right teams as soon as possible.
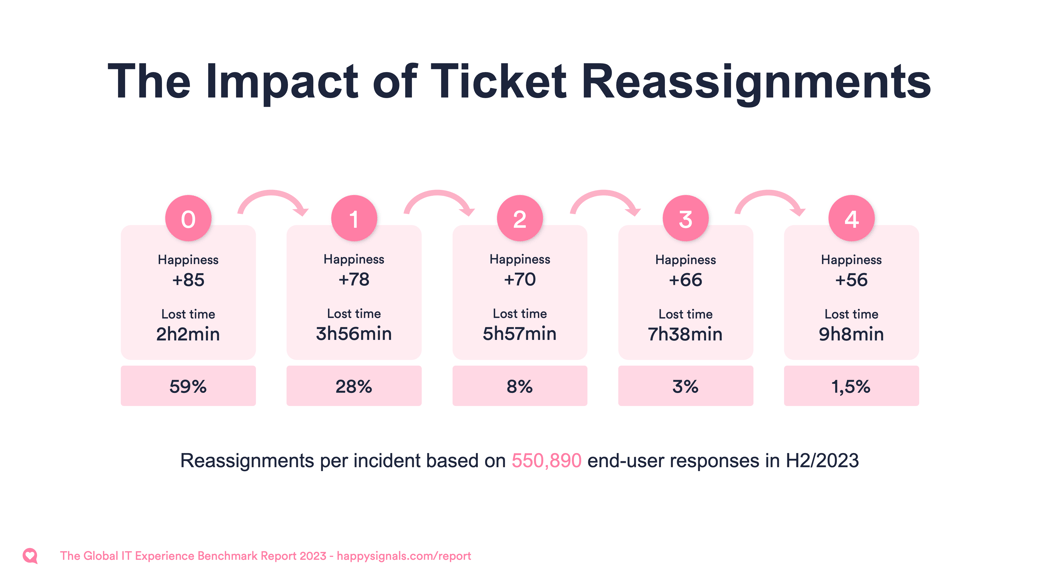
Reassignments of tickets are one of the first places where people systematically lose time. These numbers show how important it is to assign the ticket to the assignment group that can solve the
| Reassignments | H1/'20 | H2/'20 | H1/'21 | H2/'21 | H1/'22 | H2/'22 | H1/'23 | H2/'23 | |
| 0 | 56% | 55% | 52% | 51% | 53% | 54% | 55% | 59% | |
| 1 | 27% | 27% | 30% | 31% | 30% | 30% | 29% | 28% | |
| 2 | 7% | 8% | 9% | 9% | 9% | 8% | 8% | 8% | |
| 3 | 3% | 3% | 3% | 3% | 3% | 3% | 3% | 3% | |
| 4 | 1% | 1% | 1% | 2% | 1% | 1% | 1% | 1% | |
| Reassignments | H1/'20 | H2/'20 | H1/'21 | H2/'21 | H1/'22 | H2/'22 | H1/'23 | H2/'23 | |
| 0 | +76 | +79 | +81 | +82 | +81 | +81 | +82 | +85 | |
| 1 | +67 | +70 | +75 | +77 | +76 | +77 | +78 | +78 | |
| 2 | +58 | +62 | +65 | +68 | +68 | +68 | +69 | +70 | |
| 3 | +48 | +51 | +54 | +61 | +60 | +63 | +64 | +66 | |
| 4 | +43 | +45 | +46 | +50 | +51 | +51 | +51 | +56 | |
| Reassignments | H1/'20 | H2/'20 | H1/'21 | H2/'21 | H1/'22 | H2/'22 | H1/'23 | H2/'23 | |
| 0 | 2h 9min | 1h 53min | 1h 45min | 1h 54min | 1h 55min | 2h 6min | 2h 2min | 2h 2min | |
| 1 | 4h 1min | 3h 41min | 3min 23min | 3h 28min | 3h 37min | 3h 38min | 3h 37min | 3h 56min | |
| 2 | 6h 6min | 5h 23min | 5h 0min | 5h 10min | 5h 9min | 5h 45min | 5h 44min | 5h 57min | |
| 3 | 7h 56min | 7h 9min | 6h 27min | 6h 49min | 7h 7min | 7h 5min | 7h 5min | 7h 38h | |
| 4 | 9h 51min | 8h 2min | 8h 29min | 8h 16min | 8h 15min | 9h 23min | 8h 22min | 9h 8min | |
Different Support Profiles have different service expectations
While we've covered the experiences of IT end-users in previous sections, it's important to note that there are also differences in behavior and motivation among them. Knowing these differences can help tailor IT services for different types of end-users.
This is where HappySignals IT Support Profiles can be useful.
We conducted interviews with over 500 end-users and found that two main behavioral drivers, Competence and Attitude, have the greatest impact on end-user behavior and experience. Competence refers to the end-user's capability to fix IT issues independently, while Attitude pertains to their willingness to solve the problem independently.
By mapping these behavioral drivers, we defined four Support Profiles: Doer, Prioritizer, Trier, and Supported. For more information on using these profiles in the IT Service Desk, please refer to our Guide.
Consistent with previous years, Doers again have the lowest Happiness of +76, while Supported are still the happiest with Happiness of +87.
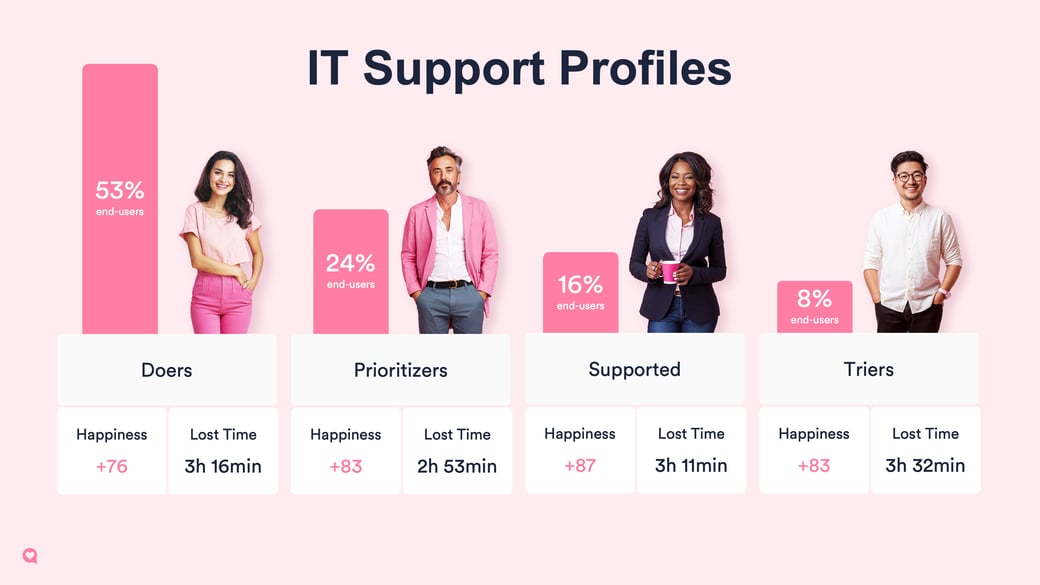
One interesting change in the data is the diminishing portion of doers and supported across the benchmark data. Prioritizers, on the other hand, have increased. This means more people today are competent IT end-users, but they still wish for IT to fix their issues.
Observing how different support profiles utilize various channels confirms the behavioral drivers identified in our original research about IT Support Profiles. The data on IT incident channel usage by different profiles reveals the following patterns:
For further information on how to customize services to better serve different end-users in the organization, we suggest downloading our Definitive Guide on IT Support Profiles.
What is the business impact of understanding end-user IT Support Profiles?Although you can't change your end-users, you can customize your IT services to suit various support profiles. One way to do this is by adjusting how service agents communicate with each profile when they contact the service desk. For instance, Doers and Prioritizers may prefer technical jargon, while Supported and Triers may benefit from simple language and step-by-step instructions. Another approach is to analyze the data by profile to identify which channels work best for each profile. Then, you can develop and promote these channels to the relevant end-user profile groups. Check out our comprehensive guide to learn more about using support profiles to enhance ticket-based services.
|
In the request process, end-users are asking for something that they need in order to do their work. Requests are submitted in increasingly varying channels. In 2019, only 7% of requests were submitted through other channels than the traditional ones in our benchmark data, but in 2023, that number of "other" channels has increased to 28% of requests.
This report currently does not include the happiness and lost time with channels, as some unusually large changes in the data at the publication data need to be double checked before publishing.
| Channel usage for IT Requests | 2019 | 2020 | 2021 | 2022 | 2023 |
| Chat | 1% | 2% | 3% | 2% | 1% |
| 8% | 8% | 9% | 6% | 3% | |
| Phone | 20% | 18% | 12% | 13% | 8% |
| Portal | 63% | 54% | 57% | 57% | 54% |
| Walk in | 1% | 2% | 1% | 1% | 6% |
| Other | 7% | 16% | 18% | 21% | 28% |
The saying “Technology changes, People stay the same” rings true in our data. The Factors that create positive, neutral, and negative experiences with IT Requests for end-users have remained stable over the last four years.
The only slight changes have been a decrease in the selection of service personnel's attitude and skills as factors, which could very well be explained by the increased number of requests that don't require service personnel to intervene. Instead, requests are increasingly handled in self-service portals.
| IT Requests - Positive Factors | 2019 | 2020 | 2021 | 2022 | 2023 |
| Speed of service | 79% | 79% | 80% | 80% | 80% |
| Service personnel's attitude | 49% | 48% | 47% | 45% | 46% |
| Service personnel's skills | 46% | 46% | 45% | 44% | 44% |
| I was informed about the progress | 31% | 34% | 36% | 34% | 37% |
| It was easy to describe what I wanted | 31% | 32% | 33% | 33% | 34% |
| Instructions were easy to understand | 29% | 31% | 32% | 32% | 33% |
| IT Requests - Neutral Factors | 2019 | 2020 | 2021 | 2022 | 2023 |
| Speed of service | 58% | 57% | 58% | 56% | 56% |
| I had to explain my case several times | 15% | 15% | 15% | 15% | 15% |
| It was difficult to know where to start | 12% | 11% | 12% | 11% | 12% |
| I wasn't informed about the progress | 11% | 12% | 11% | 11% | 11% |
| It was difficult to describe what I needed | 8% | 8% | 8% | 9% | 8% |
| Instructions were hard to understand | 8% | 8% | 7% | 8% | 8% |
| Service personnel's skills | 7% | 6% | 6% | 7% | 7% |
| Service personnel's attitude | 5% | 4% | 6% | 6% | 5% |
| IT Requests - Negative Factors | 2019 | 2020 | 2021 | 2022 | 2023 |
| Service was slow | 55% | 57% | 56% | 55% | 52% |
| I had to explain my case several times | 33% | 31% | 31% | 31% | 32% |
| I wasn't informed about the progress | 23% | 28% | 27% | 26% | 27% |
| Service personnel's skills | 17% | 16% | 13% | 13% | 14% |
| Instructions were hard to understand | 12% | 12% | 11% | 12% | 13% |
| It was difficult to know where to start | 10% | 10% | 10% | 10% | 11% |
| Service personnel's attitude | 8% | 9% | 8% | 8% | 9% |
| It was difficult to describe what I needed | 7% | 6% | 7% | 7% | 7% |

Our 2023 research into IT Experience Management shows that focusing on user experiences in IT can significantly benefit organizations. This comprehensive look at enterprise IT user experiences is based entirely on data from HappySignals customers who've adopted a user-focused approach to managing IT experiences.
The data from the entire year of 2023 reveals that ITXM offers enterprise IT leaders the tools to enact changes grounded in solid data. This data-centered strategy is designed to enhance employee satisfaction, leading to gains in productivity and better overall results for the business.
Moreover, embracing ITXM can shift the culture within IT departments, fostering an environment that's more attuned to and considerate of employees' needs.
A significant outcome of user-centered IT management is its positive effect on employee morale. When employees have good interactions with IT, they tend to stay with the company longer, reducing the costs associated with staff turnover.
Happy employees are also more involved in their work and more productive, which benefits the company. By emphasizing the importance of the user experience and making decisions based on data, companies can enhance the work-life of their employees and, at the same time, improve the organization's performance.
Intrigued? You can learn more about experience management by reading the IT Experience Management Framework (ITXM) Guide. This 10-page downloadable guide introduces ITXM and how to lead human-centric IT operations with experience as a key outcome.
Do you prefer learning through short video courses? Check out our ITXM Foundation Training & Certification Course, where you can learn the foundations of IT Experience Management in approximately one hour and get certified for free.
If you enjoyed this report, you may also visit our Learning Center for bite-sized videos and blog posts about topics from XLAs to optimize your ServiceNow solution.

Read our previous Global IT Experience Benchmark Reports.
2022:
2021:
