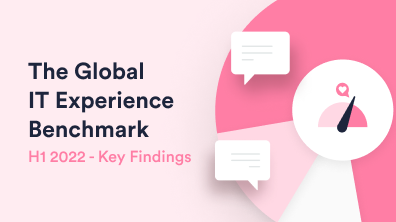
If you’re a CIO, IT Leader, Experience Owner, or Service Owner, it is important for you to understand what the word “experience” refers to in contexts of DEX, XLA, and other three-letter acronyms. The HappySignals IT Experience Benchmark tells the story from a purely human internal end-user experience with IT and identifies how people feel about IT across different IT touchpoints. Every response in the data represents a real human relying on IT to do their daily work in large enterprises.The data in this half-year report is based on 860,339 end-user responses from 130+ countries.
Key findings in the report:
- End-user perceived lost work time per reassignment has increased, increasing the importance for IT to understand the impact of reassignments.
- Response rates vary significantly across countries, providing valuable insights into where end-users may not believe their feedback matters.
- The faster tickets are solved the higher the response rate. Our data shows a linear relationship between how long a ticket is open and response rates.
- For the first time, remote work satisfaction surpasses IT service satisfaction, indicating strong end-user appreciation for remote work capabilities and benefits.


.png?width=540&height=260&name=LC_Barriers%20to%20IT%20Experience%20Management%20and%20how%20to%20overcome%20them%20(1).png)