During the last 6 months we have collected feedback from over 330.000 employees about their service experience with IT support services. We asked employees to rate the service experience, but even more importantly we also asked employees to estimate the time they lost because of this incident.
Employee Happiness is not only a soft value
The average happiness score from all our customers is +61 (calculated with formula similar to Net Promoter Score) and the average lost worktime is 2 hours 56 minutes. Already this is interesting because it means if a company has 10.000 tickets per year and the internal cost is 50€ the company is losing about 1,4M€ in productivity. But let’s see this as an opportunity - if the company could save just 30 minutes per ticket that would translate to a saving of 250.000€/year.
Comparing the experience of different channels
During the last weeks, we have been analysing the results. The most alerting discovery is the benchmark for channels and the unhappiness towards self-service portals.
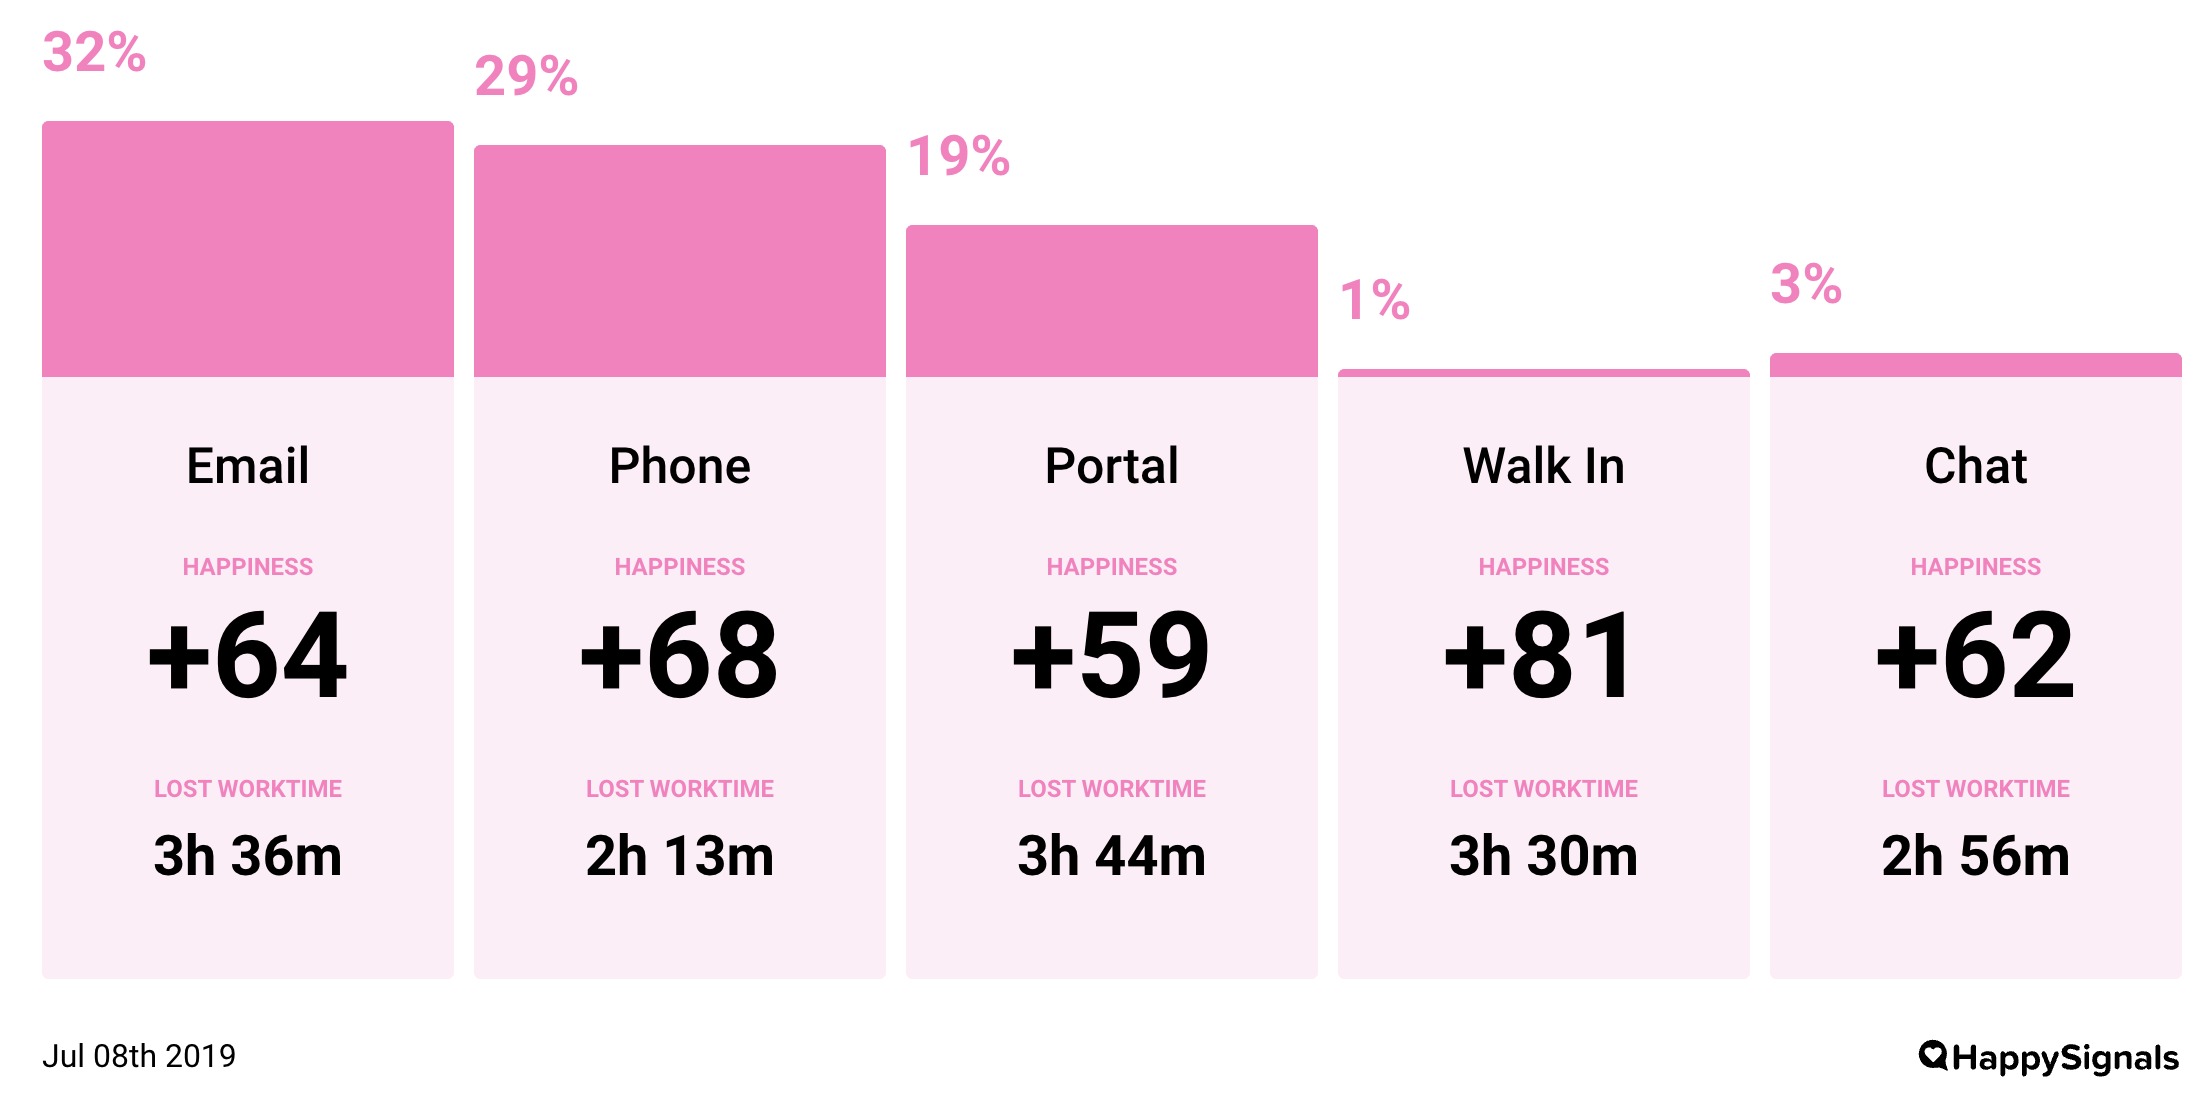
This picture bellow is real data from about 330.000 incident tickets with feedback collected from about 40 organisations. Most of this feedback is from large global enterprises.

As you can see from the infographics above on average people who started from self-service portal, lost on average almost 1.5 hours more than they lost when using the good old telephone. But it is a bit unfair to compare phone and portal, because the issues employees want to handle on the phone are a bit different than they typically want to handle in a portal. But there is no excuse why email also is almost 1 hour more efficient than the portal!
What is wrong with portals?
Isn’t the portal supposed to be the modern way? Employees like to correct issues by themselves – right?
According to these results most portals should be closed immediately, but let’s not be so quick to judge. ITSM professionals all know the benefits of portals: Possibilities for automation, assigning tickets directly to right groups, all mandatory information can be collected right away, etc.
But the problem with the earlier benefits is that all those are benefits for the process side. You should be asking yourself and your provider that what is the real benefit is for employees and whether that has been communicated that to them?
Four steps to become more employee centric?
After doing more than 500 employee interviews personally, I’m sure that those of us in Service Management need to improve in communicating the benefits of portals – and always for the benefits of employees not for benefits of IT processes.
- Marketing: Is there a clear reason for your employees to prefer and love your portal? What is the one slogan that you can use to market the portal? All services in one place? Fastest resolution because your issue is directly handled by an expert? Or just Finding the real expert? Combined ticket sending and fast resolutions? VIP lane to ServiceDesk?
- Terminology: Make sure you are not using IT or ITIL terminology like Knowledge Base, Service Catalog, Incidents, etc. Test the used terminology with regular employees, not with your IT colleagues.
- Employee Centric Design: Do the design with employees. It’s not a hard job, if you do it early enough. The hardest part in employee centric design is to really listen to what employees are saying and to let your personal ideas/opinions go. You are not building it to have the latest IT gizmos and to pump your ego, but to have it used by thousands of employees.
- Measure Employee Experience continuously and focus your development based on this data: Expectation of service changes with time, so even if users were happy with your portal a year ago, they have now gotten used to it and compare it to some consumer services they use outside of work. So you need to keep a continuous eye on employee experience development. With HappySignals you can be able to measure employee experience and understand when and why things are changing.
Happiness Score™ Benchmark information available to everybody
HappySignals has now launched this benchmark information openly to everybody, it’s updated quarterly and reflects feedback from the past 6 months.
Happiness Score™ Benchmark


