Talk to an Expert
Book a session with our ITXM™ Lead, Sakari Kyrö, to learn how to create a common focus for all of IT.
Having many different KPIs distracts IT from what matters to end users. Use HappySignals to align everyone in IT around the goal of delivering a great end user experience.
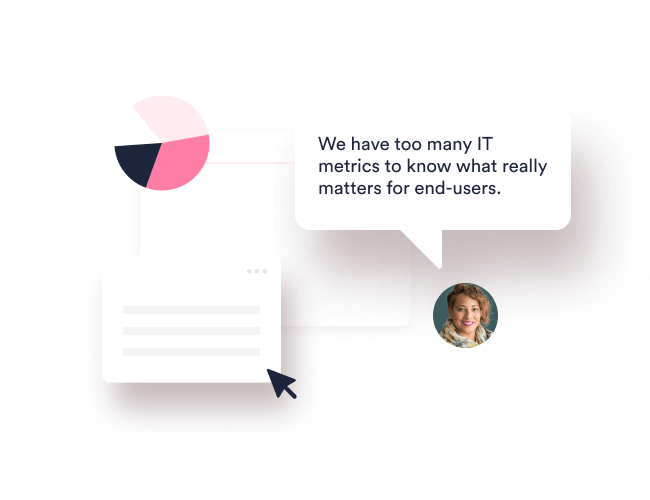
One thing about IT that remains constant regardless of how processes and technology change is the importance of providing an excellent experience for end-users. That's a common goal that everyone in IT can focus on, regardless of their role or responsibility.
HappySignals uses Happiness Score™ to measure and quantify the end user experience with IT. It comprises three key metrics tailored for internal IT – Happiness, Productivity, and Factors.
Create alignment between IT teams using these metrics to measure experiences across all IT areas. Reliably compare end-user experiences across all of IT, and understand employees' holistic IT experiences in a single view on the HappySignals platform.
|
Key takeaways:
|
One metric, one goal, one platform for all IT teams
Different teams often measure and evaluate IT using different metrics. Unite all of IT's efforts around how your internal end-users experience IT to improve the organization's perceptions of IT and achieve productivity gains.One experience metric for all internal service areas
No more juggling different metrics that tell different stories about the end-user experience. Use HappySignals to establish a common focus across all service areas.
With a continuous stream of experience data in the HappySignals platform and effortless real-time reporting, you can spend time coaching teams to deliver better experiences rather than building custom reports.
A shared focus for team members and vendors
HappySignals helps you to understand which service improvements will make end-users happier and more productive. Sharing access to the platform allows you to align teams and vendors around an Experience focus.
Drive improvement initiatives more proactively, as having real-time experience data helps you show the tangible impact your service improvements have had (and will have) on end-users.
Forget SLA-games and focus on end-user experience
Managing the service desk becomes easier for you when all agents align around the goal of delivering great experiences to end-users. Support services consistently get the highest ratings across all IT areas when service agents focus on end-user happiness.
Service desks using HappySignals have outperformed their SLA-focused counterparts, winning awards and getting recognition as valued colleagues by businesses.
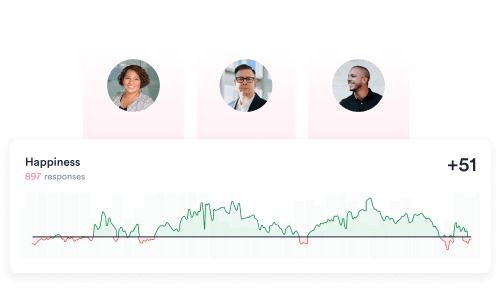
Use HappySignals to create a shared understanding of how IT supports or hinders end user Happiness and Productivity – in real-time.
With different stakeholders looking at the same experience data on a single platform, you can all agree on which IT areas are delivering poor experiences – and collaborate on improving them.
.png)
You don't need to be a data analyst to understand experience data and discover actionable insights from it.
HappySignals' intuitive interface makes experience data visible and accessible to technical and non-technical users.
Go from a 'big picture view' to a detailed view in just a few clicks. Then focus on the areas that matter most to you, depending on your role.
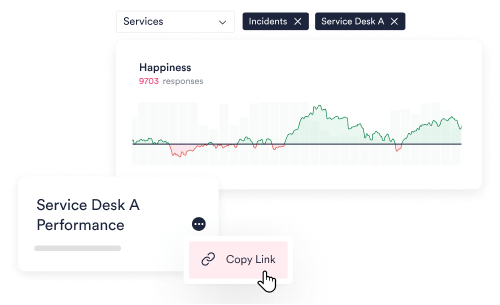
Openly share the real-time experience data with your IT teams, employees, and partners to build trust and collaboration.
Show how different areas are progressing towards the targets and make improvement a common goal for everyone.
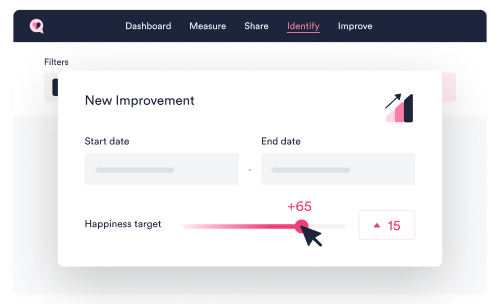
Create and manage initiatives easily straight from the HappySignals platform. Track progress towards targets and quantify the impact on end user experience.
Set and follow experience level targets with HappySignals' built-in experience level agreement (XLA) management. Ensure your teams and partners are driven by metrics that put end-users first.
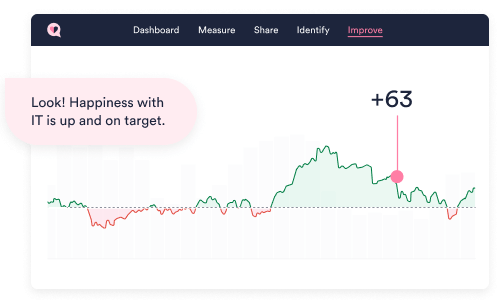
Everyone can see Happiness and Productivity increase in real-time as experience-driven improvements happen.
Celebrate the positive impact IT has on end-users and learn from past initiatives to improve, building a human-centric IT culture over time continuously.
Interested in learning more about how to create a common focus for your IT organization?
Schedule a meeting to learn more about how to align all IT stakeholders around a common goal.
You'll learn:
Book a session with our ITXM Lead, Sakari Kyrö, to learn more about how HappySignals helps you align all of IT around the same objectives.
Discover more valuable content from our Learning Center
Read more about this topic from our blog
