Get ITXM Certified
Free ITXM Foundation Course and Certification available
Maintain engagement and promote visibility with a short weekly meeting to keep end-user's experiences front and center.

Weekly Operational Meetings help keep the team(s) focused on Experience Data as it develops in real-time.
Weekly operational meetings help to embed Experience Data into everyone's ways of working, providing value and motivation in their daily work.
Contributors:
HappySignals Customers
Pasi Nikkanen / HappySignals
Reading time:
6 minutes
Level:
Operational
Updated:
2nd February 2023
Hosting weekly operational meetings is a practice that fosters a culture of human-centric IT and increases its importance among all team members.
Therefore, holding weekly operational meetings centered on Experience Data is essential. These meetings establish a habit of regularly reviewing data, analyzing feedback, and prioritizing end-user needs when developing or improving IT services.
Weekly Operational Meetings are essential to establish a culture prioritizing end-user experience within the IT team. By regularly discussing Experience Data, the team learns to leverage it and gain value from ITXM.
A formal practice also demonstrates the company's commitment to understanding end-user pain points, as neglecting to address them wastes their time and the survey insights. Failing to discuss issues can lead to negative perceptions of IT and decreased productivity among end-users.
Weekly Operational Meetings can be started very early in your ITXM journey since you can progress the agenda of the meetings as people learn more about Experience Data, the problems your end-users are facing, and the objectives you have as a team.
For example, for the first 2 months just review the data and let everyone on the team have time to understand the story the data tells.
When people start to ask detailed questions, it's time to progress the meeting into one shown below.
This can be an excellent way to start the week on Monday or the last thing you do on Friday. Just have a short 15-30 minute meeting where you look at the Experience Data, Mentions of Team members, and some of the Negative Feedback as well.
5 to 10 minutes on each bullet:
Material can be presented in a Powerpoint Presentation, but, if possible, use the real-time ITXM platform to save time and unnecessary work before the meeting. This will also encourage others to use the tool as they see how quick and easy it is.
Not creating static Powerpoint presentations saves you time when you can open the real-time views and discuss the data in the meeting.
Here are some examples:

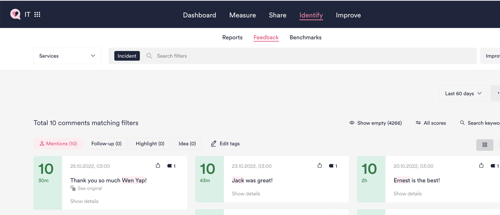
Automatic tagging of mentions: HappySignals automatically tags names from comments, so you can filter scores 9 & 10 and click the Mentions filter. Then you can read all the positive mentions in the meeting with the team.

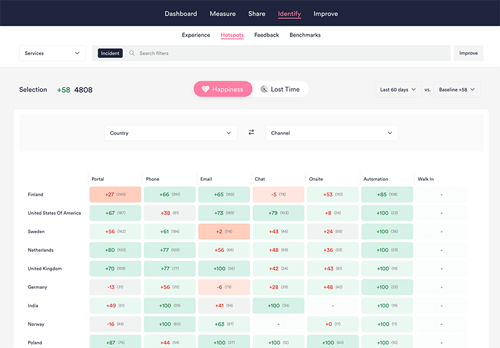
Create heat maps: Cross-reference data categories to expose experience gaps, e.g., Country and Channel or Location and Service.
The areas highlighted in dark red have high response volume (many affected end-users) and a large negative difference in Happiness / Lost Time compared to Baseline, Previous period, or Target – depending on your selection.
